Acquire Signal Spectrum on Rohde & Schwarz Spectrum Analyzer Using IVI-C Driver
This example shows how to initialize the rsspecan IVI-C driver, read a few properties from the driver, acquire a signal spectrum using Rohde & Schwarz® spectrum analyzer, and visualize the spectrum in MATLAB®.
Requirements
To run this example, you must have Rohde & Schwarz Spectrum Analyzer IVI-C x64 driver version 2.0.1 installed on your computer.
View Installed IVI-C Drivers
View a list of the IVI-C drivers and associated MATLAB drivers that are installed on your computer using ividriverlist.
list = ividriverlist
list=14×4 table
             VendorDriver          MATLABDriver            IVIClass                                            SupportedModels
          __________________    __________________    __________________    _____________________________________________________________________________________

    1     "IviACPwr"            "IviACPwr"            "IVIACPwr"            {[""                                                                               ]}
    2     "IviCounter"          "IviCounter"          "IVICounter"          {[""                                                                               ]}
    3     "IviDCPwr"            "IviDCPwr"            "IVIDCPwr"            {[""                                                                               ]}
    4     "IviDigitizer"        "IviDigitizer"        "IVIDigitizer"        {[""                                                                               ]}
    5     "IviDmm"              "IviDmm"              "IVIDmm"              {[""                                                                               ]}
    6     "IviDownconverter"    "IviDownconverter"    "IVIDownconverter"    {[""                                                                               ]}
    7     "IviFgen"             "IviFgen"             "IVIFgen"             {[""                                                                               ]}
    8     "IviPwrMeter"         "IviPwrMeter"         "IVIPwrMeter"         {[""                                                                               ]}
    9     "IviRfSigGen"         "IviRfSigGen"         "IVIRfSigGen"         {[""                                                                               ]}
    10    "IviScope"            "IviScope"            "IVIScope"            {[""                                                                               ]}
    11    "IviSpecAn"           "IviSpecAn"           "IVISpecAn"           {[""                                                                               ]}
    12    "IviSwtch"            "IviSwtch"            "IVISwtch"            {[""                                                                               ]}
    13    "IviUpconverter"      "IviUpconverter"      "IVIUpconverter"      {[""                                                                               ]}
    14    "rsspecan"            "rsspecan"            "IVISpecAn"           {["ESW"    "FPH"    "FPS"    "FSV"    "FSVA"    "FSVR"    "FSW"    "FSWP"    "FSWT"]}
In this example, you use the rsspecan MATLAB driver.
Connect to Instrument
Connect to a simulated Rohde & Schwarz® spectrum analyzer using ividev with the instrument's MATLAB driver name and resource name. This example uses the rsspecan driver's simulation mode to run without physically connecting any hardware. Since simulation mode is enabled, the resource name can be specified as empty.
dev = ividev("rsspecan","",Simulate=true)
dev =
  rsspecan with properties:

                      Model: "FSW-26"
               Manufacturer: "Rohde&Schwarz"
               SerialNumber: ""
               ResourceName: ""
               VendorDriver: "rsspecan"
                   Simulate: 1

                  MarkerIDs: ["1", "2", "3", "4", "5", "6", "7", "8", "9", "10", ... ]
                   TraceIDs: ["TRACE1", "TRACE2", "TRACE3", "TRACE4", "TRACE5", "TRACE6", ... ]

      InherentIVIAttributes: [1x1 InherentIVIAttributes]
             BasicOperation: [1x1 BasicOperation]
                    Markers: [1x16 Markers]
                    Trigger: [1x1 Trigger]
             DisplayControl: [1x1 DisplayControl]
             ExternalMixing: [1x1 ExternalMixing]
    MiscellaneousAttributes: [1x1 MiscellaneousAttributes]

Show all functions
Get General Instrument Properties
Query information about the driver and its attributes. You can explore properties and sub-properties of the object by clicking on the property links from the object output display.
dev.InherentIVIAttributes
ans =
  InherentIVIAttributes with properties:

                   UserOptions: [1x1 UserOptions]
          DriverIdentification: [1x1 DriverIdentification]
            DriverCapabilities: [1x1 DriverCapabilities]
      InstrumentIdentification: [1x1 InstrumentIdentification]
    AdvancedSessionInformation: [1x1 AdvancedSessionInformation]
dev.InherentIVIAttributes.DriverIdentification
ans =
  DriverIdentification with properties:

                       Description: "Rohde & Schwarz Signal and Spectrum Analyzer IVI-C Driver"
                      DriverPrefix: "rsspecan"
                      DriverVendor: "Rohde&Schwarz"
                          Revision: "Driver: rsspecan 2.0 (2.0.1.13), Compiler: CVI 15.00, Components: IVIEngine 16.00, VISA-Spec 5.70"
    ClassSpecificationMajorVersion: 1
    ClassSpecificationMinorVersion: 0
Set Center Frequency and Span
Configure the frequency range of the spectrum analyzer using the center frequency and frequency span.
centerFrequency = 2E+9;
frequencySpan = 500E+6;
configureFrequencyCenterSpan(dev,centerFrequency,frequencySpan)
Set Single Sweep
Configure the acquisition attributes of the spectrum analyzer.
sweepModeContinuous = false;
numberOfSweeps = 1;
detectorTypeAuto = true;
detectorType = "DETECTOR_TYPE_AUTO_PEAK";
verticalScale = "VERTICAL_SCALE_LINEAR";
configureAcquisition(dev,sweepModeContinuous,numberOfSweeps,detectorTypeAuto,detectorType,verticalScale)
Configure Reference Level and Range
Configure the vertical attributes of the spectrum analyzer, including amplitude units, input attenuation, input impedance, reference level, and reference level offset.
amplitudeUnits = "AMPLITUDE_UNITS_DBM";
inputImpedance = 50.0;
referenceLevel = -10.0;
referenceLevelOffset = 0;
attenuationAuto = false;
attenuation = 10.0;
configureLevel(dev,amplitudeUnits,inputImpedance,referenceLevel,referenceLevelOffset,attenuationAuto,attenuation)
Configure Coupling and Sweep Attributes
Configure the coupling and sweep attributes of the spectrum analyzer, including resolution bandwidth, video bandwidth, and sweep time.
resolutionBandwidthAuto = false;
resolutionBandwidth = 1.0E+6;
videoBandwidthAuto = false;
videoBandwidth = 1.0E+6;
sweepTimeAuto = false;
sweepTime = 5.0E-3;
configureSweepCoupling(dev,resolutionBandwidthAuto,resolutionBandwidth,videoBandwidthAuto,videoBandwidth,sweepTimeAuto,sweepTime)
Perform Sweep
Initiate a signal acquisition based on the present instrument configuration. The function readYTrace waits for the acquisition to complete and returns the trace as an array of amplitude values. The amplitude array returns data that represents the amplitude of signals of the sweep from the start frequency to the stop frequency. The amplitude units attribute determines the units of the points in the amplitude array.
maximumTimeMs = 5000;
arrayLength = 501;
amplitudeX = 1.75e+09:0.1e+07:2.25e+09;
[actualPointsY,amplitudeY] = readYTrace(dev,"TRACE1",maximumTimeMs,arrayLength);
Visualize Data and Display Any Errors
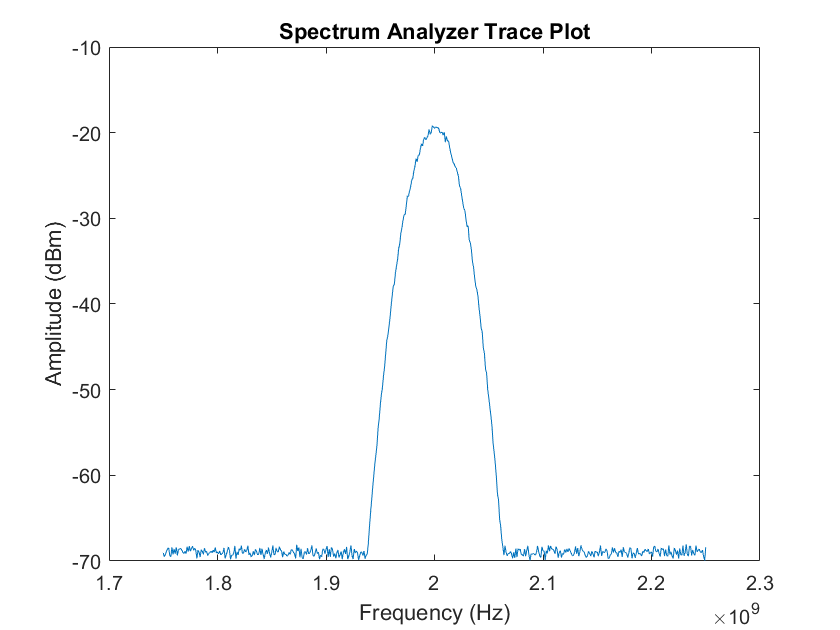
Display the acquired spectrum.
plot(amplitudeX,amplitudeY);
title('Spectrum Analyzer Trace Plot');
xlabel('Frequency (Hz)');
ylabel('Amplitude (dBm)');

If there are any errors, query the driver to retrieve and display them.
errorNum = 1;
while (errorNum ~= 0)
    [errorNum,errorMsg] = error_query(dev);
    fprintf('ErrorQuery: %d, %s\n',errorNum,errorMsg);
end
ErrorQuery: 0, No error.
Clean Up
Disconnect and clear ividev object from the workspace.
clear devSee Also
ividriverlist | ividevlist | ividev