getAxesHandle
Get handle to axes in Slice Viewer
Syntax
Description
Examples
Load MRI data into the workspace.
load mristackCreate a display panel used to display the slices and the slider.
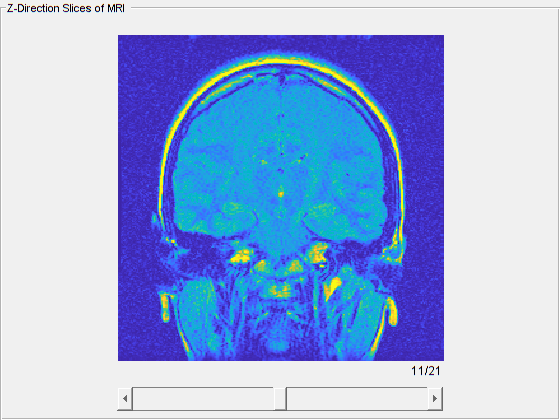
ViewPnl = uipanel(figure,"Title","Z-Direction Slices of MRI");
View the data in the slice viewer, specifying a custom colormap for viewing the slices. The slice viewer opens the stack of images and displays the one in the middle. Use the slider to view a different slice.
cmap = parula(256);
s = sliceViewer(mristack,"Colormap",cmap,"Parent",ViewPnl);
Get the handle to the axes that contains the image slices in the slice viewer.
hAx = getAxesHandle(s)
hAx =
  Axes with properties:

             XLim: [0.5000 256.5000]
             YLim: [0.5000 256.5000]
           XScale: 'linear'
           YScale: 'linear'
    GridLineStyle: '-'
         Position: [116.8627 57.5000 326.2745 326.2745]
            Units: 'pixels'

  Show all properties
Input Arguments
Output Arguments
Version History
Introduced in R2019b