PI Viewer
Description
The PI Viewer allows you to graphically search and select tags on an AVEVA® PI Data Archive, then plot data from those tags.
You can plot and examine the data from the tags over a specified time range
Note
You must install the AF SDK library to connect to a PI server from MATLAB®. For more information, see AF SDK Overview.
Open the PI Viewer
To open the PI Viewer app, in the MATLAB command line type:
viewer(piClientObj)
where piClientObj is the PI Data Archive client created with the
piclient
function.
Examples
Create a PI client object and open the PI Viewer for reading tags from the PI Data Archive.
piClientObj = piclient("pi-host-55");
viewer(piClientObj)
Select the tags you want to read from, and click the right-arrow to add them to the right-hand column.
If you want to limit the date range, click the Start Date field and End Date field. A calendar pops up for you to select the start and stop dates.
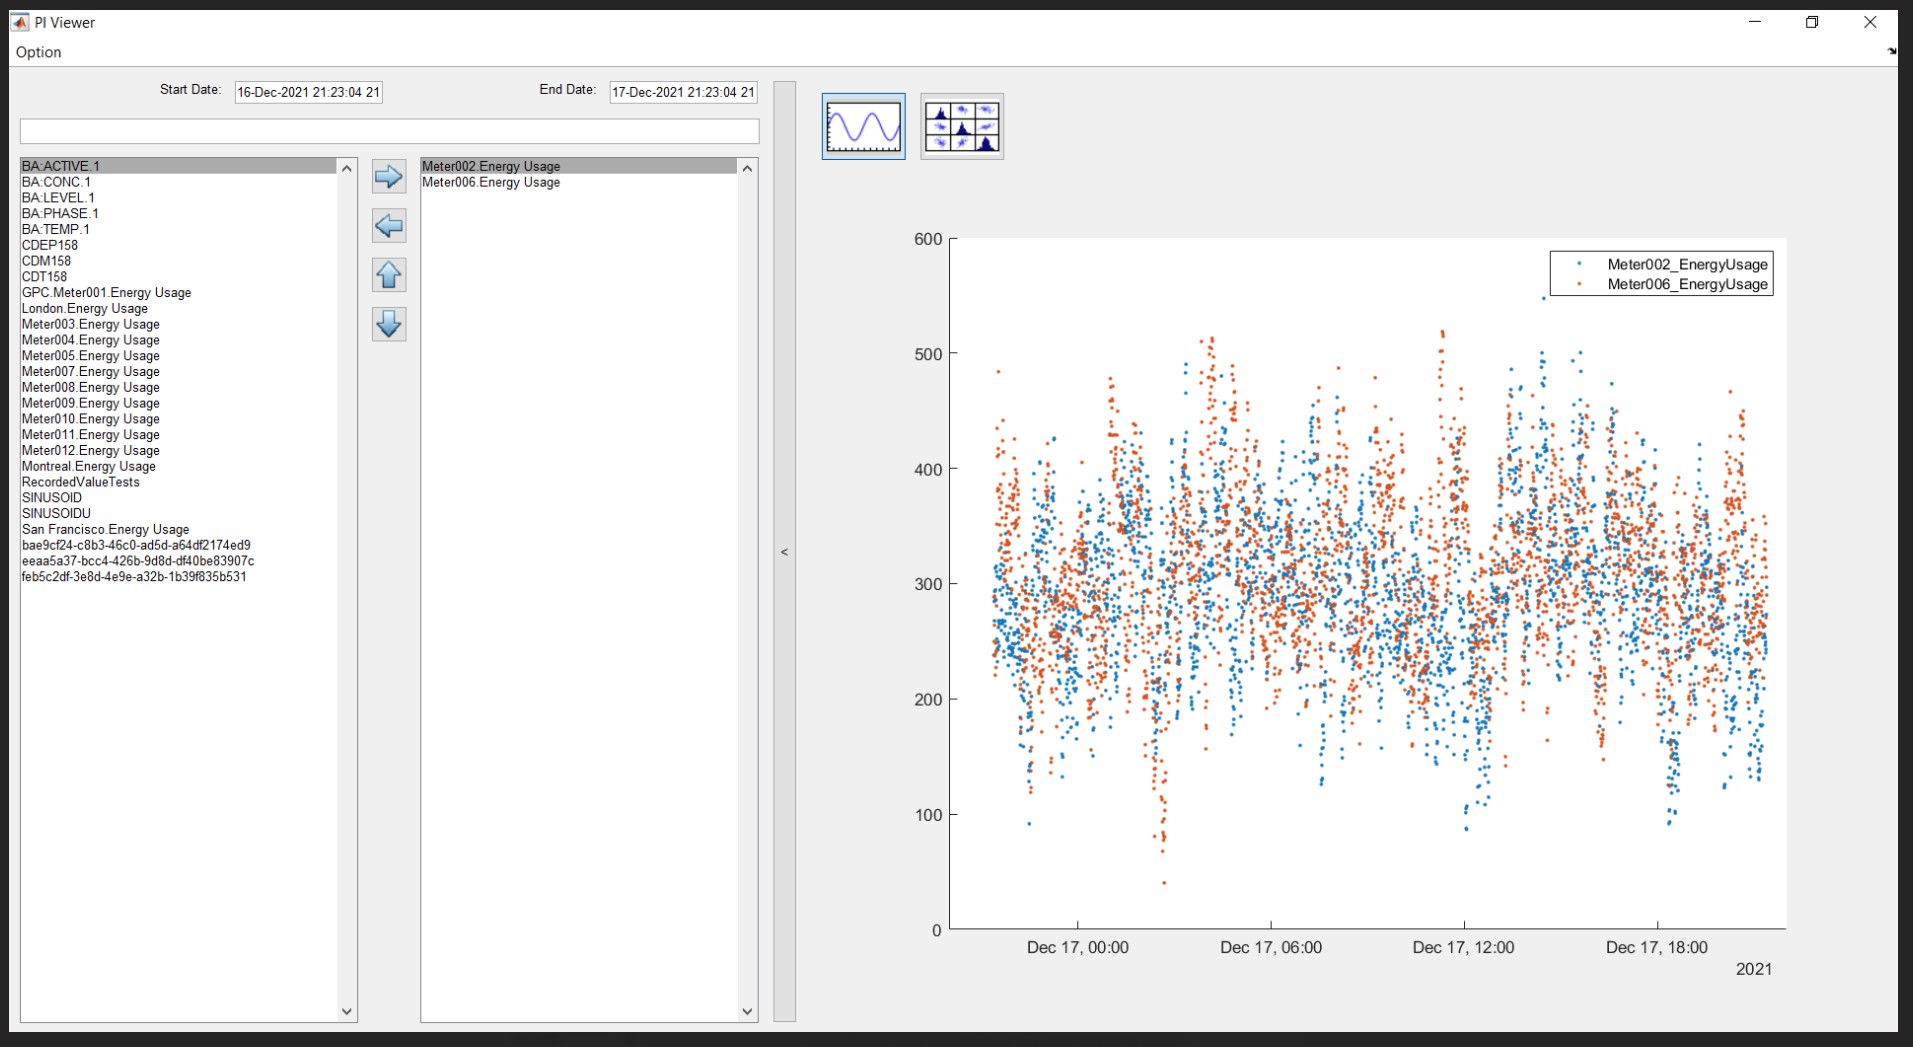
Select the type of graphs you want to view:
Click
 to plot all data points on a common time
axis.
to plot all data points on a common time
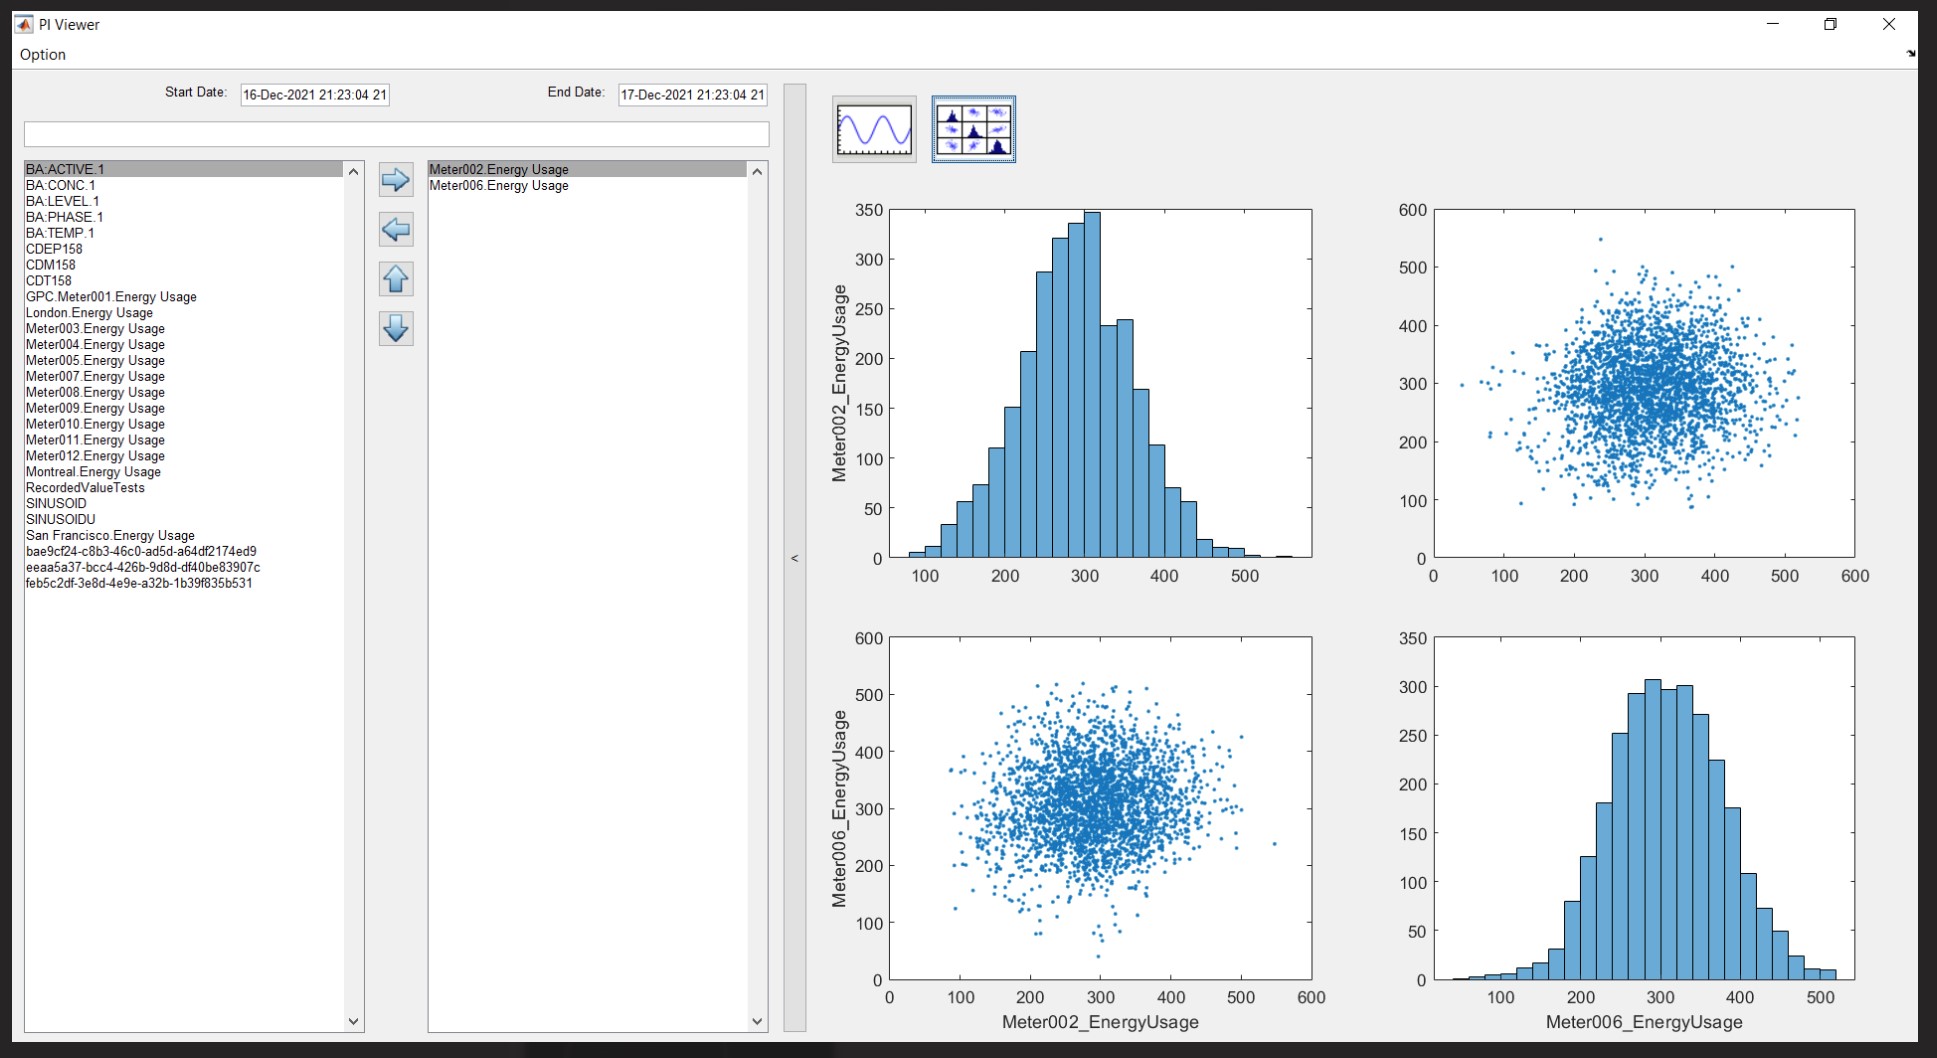
axis.Click
 to generate a matrix of plots, displaying
histograms and scatter plots by data groups, in a manner similar to the
to generate a matrix of plots, displaying
histograms and scatter plots by data groups, in a manner similar to the
gplotmatrixfunction.The PI Viewer display might look something like this:
Version History
Introduced in R2022a