Perform a Failure Mode and Effects Analysis on a Rotorcraft UAV
This example shows how to inject faults on an architecture model of an unmanned aerial system (UAS) to verify the safety properties in a Failure Mode and Effects Analysis (FMEA). The system models the hardware and controls that pilot a rotorcraft unmanned aerial vehicle (UAV). To determine the scope of the analysis to perform, this example uses custom callbacks in a Safety Analysis Manager spreadsheet. The spreadsheet uses MATLAB® functions and Simulink® simulations to verify that the failure modes caused by the faults produce the predicted effects.
Download the Files and Open the Project
This example uses files in a public GitLab® repository created and maintained by researchers affiliated with
Technische Universität München. See EPUCOR FMEA Case
Study. To get a copy of the files, clone the repository by using the
gitclone function.
gitclone("https://gitlab.com/tum-fsd/epucor-fmea-case-study");Inspect the Architecture Model
The repository uses projects to establish the file dependencies. To view and simulate
just the architecture, open the folder that contains the repository files, then open the
EPC_Architecture project in the
01_Architecture folder.
cd epucor-fmea-case-study
architecture_proj = openProject("01_Architecture/EPC_Architecture.prj");
To view the configuration, open the EPC_Architecture architecture
model.
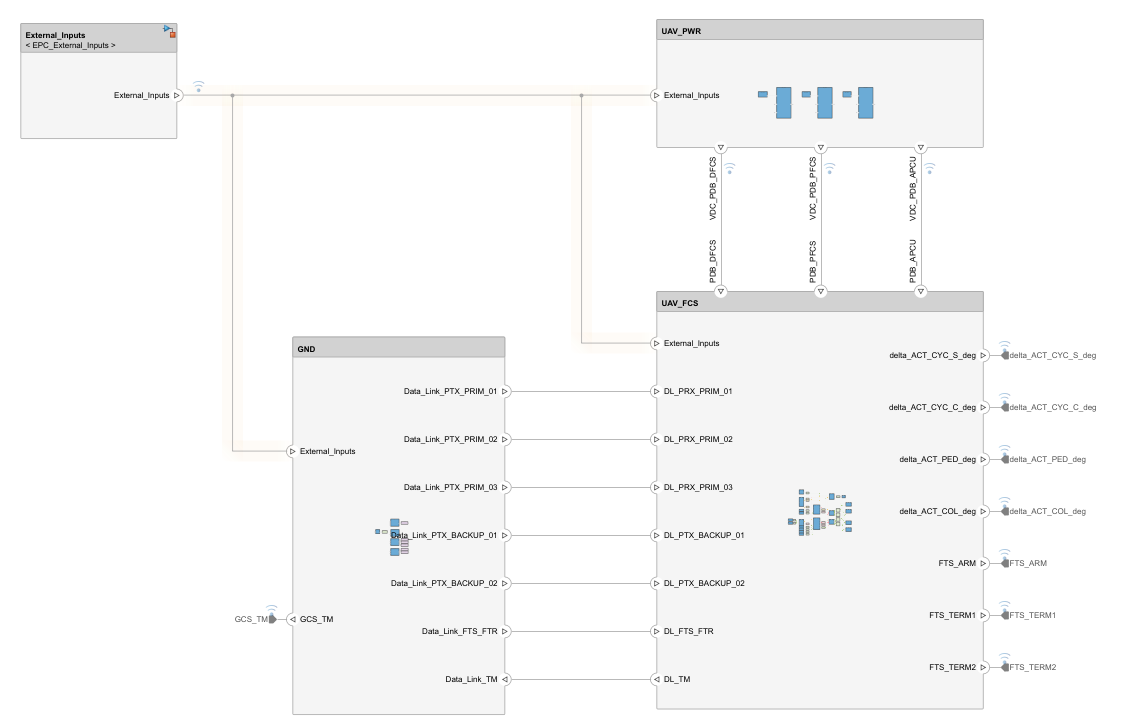
open_system("EPC_Architecture")The architecture model represents the hardware and software that controls a real coaxial rotorcraft UAV. This design references the work described in Hosseini et al. [1]. The architecture model contains four main architecture components.
External_Inputs— The user inputs that remotely control the UAV. The component uses a Signal Editor block to output signals from one of four scenarios. To select a scenario, open theExternal_Inputscomponent, double-click the Signal Editor block, and update the value in the Active scenario property.UAV_FCS— The electronic control units, sensors, actuators, and digital communications on the UAV, also known as the flight control system.UAV_PWR— The power supply of the onboard flight control system.GND— The control and monitoring units on the ground, also known as the ground segment.
To model the system, the UAV_PWR, UAV_FCS, and
GND components use protected Referenced Component
blocks.
View an Emulator for the Ground Monitoring Unit
Pilots control and view the status of the UAV from the ground segment. To display
the status received by the ground segment, the model includes an emulator of the
primary instrument panel attached to the ground segment, known as the
ground monitoring unit. In the GND
component, open the GMU component to view the emulator. The
emulator represents the ground monitoring unit as a collection of images.

If the model detects an equipment failure, the emulator updates by crossing out the affected panel artifact or by illuminating the artifact in red. Unlike a physical ground monitoring unit, this emulator does not display other data.
The blocks in the ETH interface section take the detection
logic data and configure it to update the panel images. To view the logic, open the
RX_Wrapper block.
To learn more about the technical details of the architecture, view the
ArchitectureDescription.mlx live script in the
01_Architecture folder, in addition to the work published by
Hosseini et al. [1].
Inspect and Simulate the Faults
To view and analyze the faults, open the EPC_FMEA project. The
EPC_FMEA project establishes the dependencies used to add the
faults to the model. Close the EPC_Architecture project, open the
EPC_FMEA project, and then reopen the
EPC_Architecture architecture
model.
close(architecture_proj);
openProject("EPC_FMEA.prj");
open_system("EPC_Architecture")
Inspect Faults
To view the faults, open the Fault Table pane In the Apps tab, click Fault Analyzer. Then, in the Fault Analyzer tab, in the View section, click Fault Table. The architecture model contains 133 faults.
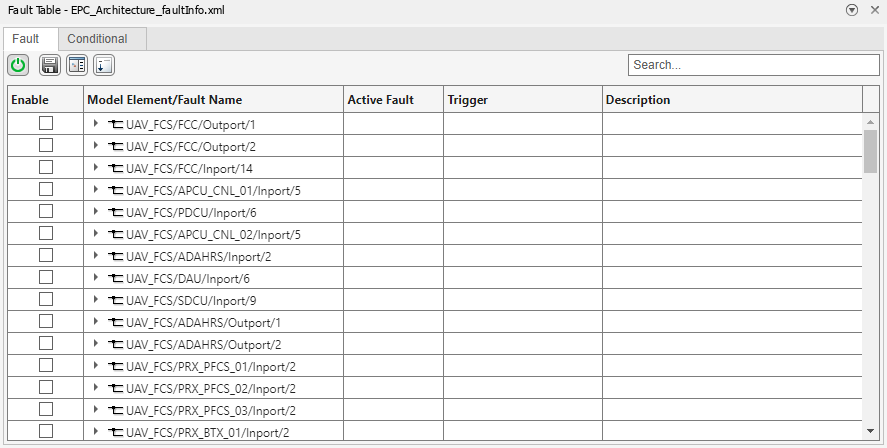
To view the faults, expand each model element. Several of the faults do not have
behaviors. Other faults use behaviors defined in the
EPC_FaultLibrary library. You can add fault behavior from
this library to a fault by selecting the library in the Fault
library property. For more information on creating, storing, and
accessing custom fault behaviors, see Customize Fault Behaviors by Using Libraries.
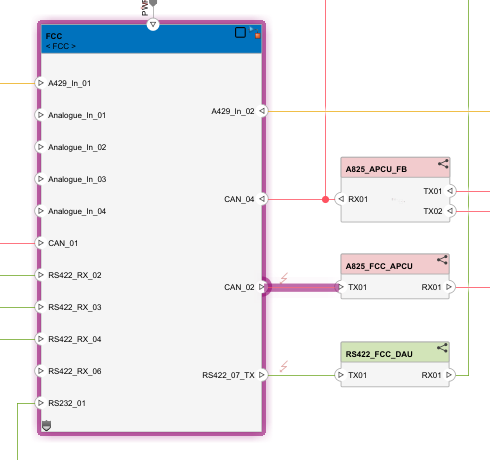
To navigate to a fault, enter a partial match for the fault or the model element
that has the fault in the search bar. Then, right-click the fault and select
Show faulted model element in canvas. This image
shows the location of the fault on the CAN_02 output of the
FCC referenced model.
Simulate Fault Combinations
You can select and simulate any number of
faults in a simulation. For example, to simulate only the
RS422_07_Loss fault on the first output port of the flight
control computer (FCC), enable the UAV_FCS/FCC/Outport/2 model
element and disable the other model elements in the Fault Table
pane. Because the RS422_07_Loss fault is the only fault on the
model element, the fault also activates when you enable the model element.
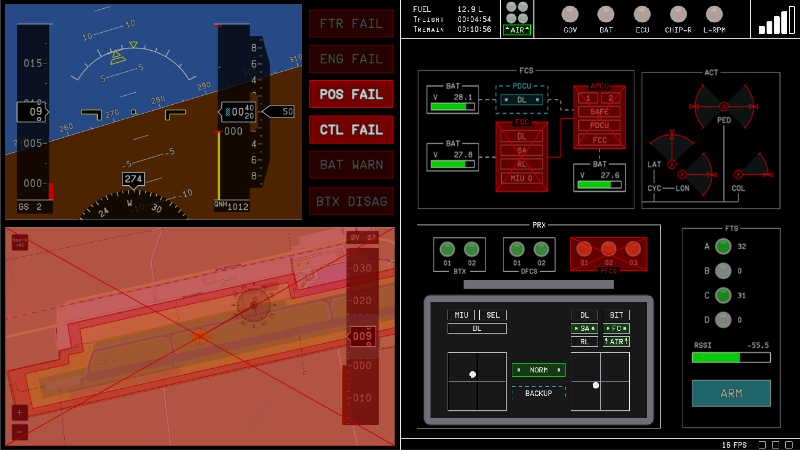
Enable fault simulation. In the Fault Analyzer tab, click Fault Simulation to set the status to on. Simulate the model. The ground monitoring unit emulator indicates that the model detects seven failures by highlighting the components in red.
To view additional simulation information, open the Simulation Data Inspector. This model logs data from the architecture model and the fault injection status of the active faults.
View the FMEA
The repository includes an FMEA developed by Rhein et al. [2] and a live
script, GettingStarted.mlx, that describes the features and
functionality in the FMEA. The EPC_FMEA project establishes the
dependencies that the FMEA uses to simulate and analyze the architecture model. To
represent the FMEA, the project includes four spreadsheets. To view the FMEA, open the
Safety
Analysis Manager and the EPC_FMEA spreadsheet.
safetyAnalysisManager
safetyAnalysisMgr.openDocument("EPC_FMEA.mldatx");
Opening the EPC_FMEA spreadsheet also opens these supporting spreadsheets:
EPC_FMEA_SLE— The system-level effects that can occur as a result of failure of a component. If the Component column cell is blank, the effect is associated with the first non-blank component above it.EPC_FMEA_TLE— The broader UAS effects that can occur as a result of a failure mode, their severity, and their mitigation strategies.EPC_FMEA_Scenarios— The scenarios that the model can simulate. TheEPC_FMEAspreadsheet uses this spreadsheet to determine which scenarios to simulate for each failure mode.
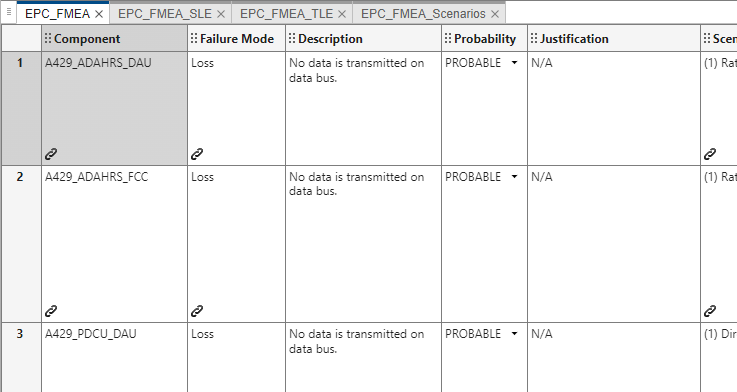
Use the EPC_FMEA spreadsheet to analyze the failure modes and
effects. The EPC_FMEA spreadsheet
contains these columns:
| Column Label | Description |
|---|---|
| Component | The affected architectural model immediately downstream from the fault. |
| Failure Mode | The failure mode type associated with a fault. |
| Description | The description of the failure mode. |
| Probability | The qualitative probability that the failure mode occurs. The
column limits the cell values to a value of
PROBABLE or
IMPROBABLE. |
| Justification | The justification for the probability evaluation. If the
Probability column cell in the same row is
IMPROBABLE, you must populate content in the
Justification column cell. |
| Scenario | The flying scenario where the failure mode occurs. The flying
scenario corresponds with the scenario defined by the
External_Inputs component. |
| System Level Effect | The effects that the failure mode has locally at the system level. |
| UAS Level Effect | The effects that the failure mode has on the entire UAS. |
| Severity | The severity of the failure mode if it occurs. The Severity column limits the cells to one of five enumerated values that rank from least to largest severity in this order:
|
| Mitigations | The strategy available to mitigate the failure mode if it occurs. These strategies involve engineering precautions and interventions that the UAV operators can execute. In this example, each failure mode has no more than one mitigation strategy. |
Analyze Spreadsheet by Using Callbacks
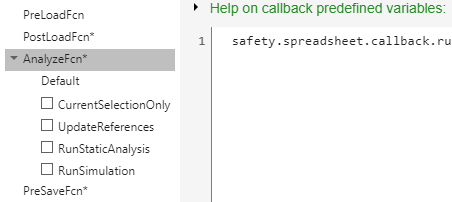
To run and maintain the spreadsheet, the EPC_FMEA spreadsheet uses
custom callbacks. For more information on custom callbacks, see Create Custom Callbacks. To view the
callbacks, select the EPC_FMEA spreadsheet. in the
Analyze section, click Edit Callbacks.
The spreadsheet defines four custom callbacks:
CurrentSelectionOnly— Whether to analyze the failure mode and effects in the rows of the selected cells, or to analyze the entire spreadsheet. The status of this callback affects the other callbacks.UpdateReferences— Updates the spreadsheet values before executing other analyses.RunStaticAnalysis— Executes a static analysis on the spreadsheet.RunSimulation— Executes a simulation-based analysis of the architecture model and evaluates the results with the spreadsheet contents.
The callbacks run externally defined functions from MATLAB packages. You can find these functions in the
03_Tools/SafetyTools folder.
The callbacks leverage the Requirements Toolbox™ links in the spreadsheet. For more information on creating links to Safety Analysis Manager spreadsheet artifacts, see Link Safety Analysis Manager Spreadsheet Cells and Rows to Linkable Items.
Update the Spreadsheet
The EPC_FMEA spreadsheet includes 133 failure modes. To
populate some of the content, the spreadsheet uses the
UpdateReferences custom callback. The callback identifies the
supporting spreadsheets and relevant data by using the link in each cell and the
spreadsheet document attributes. If the document attributes or links are incorrectly
defined, the callback generates an error. After identifying the supporting files and
links, the callback updates these column cells:
Component — The cells match the name of the linked model element in the
EPC_Architecturearchitecture model. Each cell must link to only one model element. If the cell is blank, the failure mode in this row is associated with the first non-blank component above it.Failure Mode — The cells match the name of the linked fault in the
EPC_Architecturearchitecture model. Each cell must link to only one fault.Scenario — The cells match the linked cell value in the Scenario column of the
EPC_FMEA_Scenariosspreadsheet. If a cell in the Scenario column contains more than one link, the callback populates the linked cell values as a list.System Level Effect — The cells match the linked cell value in the Effect column of the
EPC_FMEA_SLEspreadsheet. If a cell in the Effect column contains more than one link, the callback populates the linked cell values as a list.UAS Level Effect — The cells match the linked cell value in the Effect column of the
EPC_FMEA_TLEspreadsheet. If a cell in the UAS Level Effect column contains more than one link, the callback populates the linked cell values as a list.Severity — The cells match the cell value in the Severity column that is in the same row of the linked value in the Effect column of the
EPC_FMEA_TLEspreadsheet. If a cell in the UAS Level Effect column contains more than one link, the spreadsheet cell uses the biggest severity of the linked effects.Mitigations — The cells match the cell value in the Mitigations column that is in the same row of the linked value in the Effect column of the
EPC_FMEA_TLEspreadsheet.
You manually define the cell values in the Description, Probability, and Justification columns.
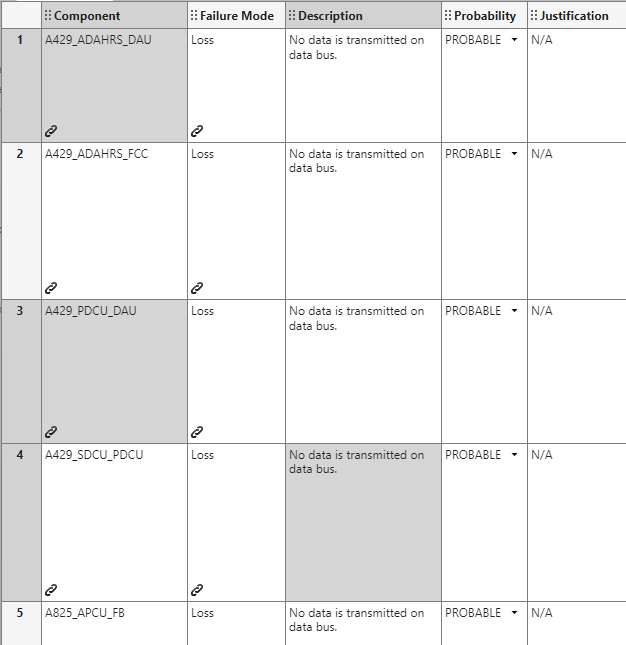
To update the content in the spreadsheet, in the Analyze
section, click Edit Callbacks and select
UpdateReferences. Close the Callbacks Editor window and click
Analyze Spreadsheet. If you enable the
CurrentSelectionOnly callback, running the
UpdateReferences callback updates only the rows that contain
the selected cells. For example, running the callback with the selection in the
image updates only the first, third, and fourth rows.
Tip
If you want to create references in spreadsheets outside of this example, create references by defining them in derived columns instead. Derived column references do not use callbacks. For more information on references in Safety Analysis Manager spreadsheets, see Create References in Derived Column Cells.
Run Static Analysis
To check the integrity of the spreadsheet, run the
RunStaticAnalysis custom callback. The callback checks for
these requirements in the spreadsheet:
No failure mode can have a
CATvalue in the Severity column.If the failure mode has a
PROBABLEvalue in the Probability column, the failure mode must not have a value in the Severity column that is more severe thanMAJ.If the failure mode has a
PROBABLEvalue in the Probability column and the value in the Severity column is equal to or more severe thanMAJ, the failure mode must have a value in the Mitigation column.If the failure mode has an
IMPROBABLEvalue in the Probability column, the failure mode must have a value defined in the Justification column.If the cell in the Component column of the failure mode has a value, the cell must link to a model element in the
EPC_Architecturemodel.Each cell in the Failure Mode column must link to a fault in the
EPC_Architecturemodel.For each failure mode, the cells in the Failure Mode, Description, Scenario, System Level Effect, and the UAS Level Effect columns must have content.
After completing the analysis, the callback adds flags to the spreadsheet that indicate compliance or issues with the failure modes.
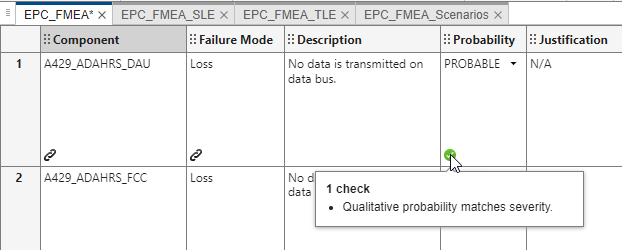
For example, to perform static analysis on the first row:
Select at least one cell in each of the first row.
Expand Analyze Spreadsheet, select the
CurrentSelectionOnlyandRunStaticAnalysiscallbacks, and clear theUpdateReferencesandRunSimulationcallbacks.Click Analyze Spreadsheet.
The callback adds a check flag to the cell in the Probability column. Point to the flag to read the flag description.
You can analyze several failure modes or the entire spreadsheet. To view an
instance where a failure mode does not satisfy the requirements, analyze row
113. The spreadsheet adds an error flag
to the cell in the
Probability column.
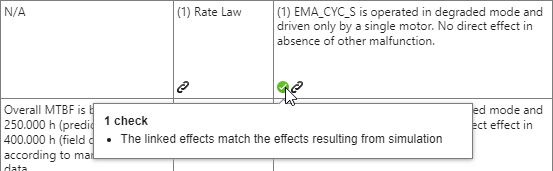
Run Simulation-Based Analysis
You can run simulation-based analysis from the spreadsheet by enabling the
RunSimulation callback. The callback executes a simulation
for each failure mode that you select and then compares the output to an expected
result. For each failure mode that you simulate, the callback configures the
simulation to these circumstances and evaluation criteria:
The simulation injects only the linked faults, and deactivates the others.
The model selects the linked scenarios and simulates for each one.
After simulating, the model evaluates each effect by running the function listed in the Effect Observer column in the
EPC_FMEA_SLEspreadsheet. The callback identifies this function based on the linked cells in the System Level Effect column. If the System Level Effect column cell links to more than one effect, the callback executes the associated function for each effect. You can find these functions in the02_Safety/Effectsfolder.The callback compares the logged results of the model to the evaluation of the functions. If the evaluation and the logged results do not match, the spreadsheet adds a warning flag to the model.
For example, to simulate the 52nd and 53rd failure modes and check their effects:
Select at least one cell in each of the rows.
Expand Analyze Spreadsheet, select the
CurrentSelectionOnlyandRunSimulationcallbacks, and clear theUpdateReferencesandRunStaticAnalysiscallbacks.Click Analyze Spreadsheet.
The callback adds a check flag to the cell in the System Level Effect column, which indicates that the anticipated effects calculated by the functions match the observed effects in the model for each failure mode. Point to the flag to read the flag description.
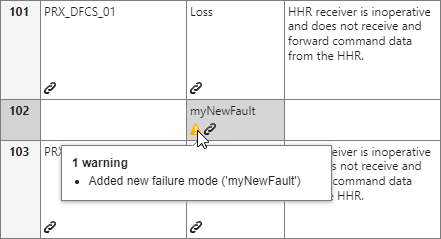
Synchronize Faults and Model Elements to Spreadsheet
In the EPC_FMEA spreadsheet, the PreSaveFcn
callback updates the list of components and failure modes when you save the model. When
you save the spreadsheet, the spreadsheet prompts you with an option to synchronize the
spreadsheet. If you synchronize, the callback updates the spreadsheet to include only
the existing components and faults before saving.
For example, if you add a fault to the model and save the spreadsheet, the spreadsheet
adds the fault and links to it in a new row as a new failure mode. The spreadsheet adds
a warning flag to the cell in the Failure Mode column. This image
shows the spreadsheet after you add a fault to an output port of the
PRX_DFCS_01 component and synchronize the spreadsheet.
To run an analysis on this failure mode, you must add the required links to the
System Level Effect and
UAS Level Effect column
cells and run the UpdateReferences callback.
Disclaimer and Data Reuse License
The images in this example were captured by using a copy of the repository. In
addition to the referenced studies, the text on this page is informed by content in the
ArchitectureDescription.mlx and
GettingStarted.mlx live scripts in the repository, and are used
with permission from the authors. The images and the text presented in this example are
approved by the authors.
Data Reuse License
This license applies to the files in the repository that you download in this example.
Copyright 2024, Institute of Flight System Dynamics, Technische Universität München
Redistribution and use of this data set, with or without modification, are permitted provided that the following conditions are met:
Redistribution in any form must retain the above copyright notice, this list of conditions and the following disclaimer.
Redistribution and use in any form must be accompanied by the following acknowledgement:
This product uses models, software and FMEA tables provided by courtesy of the Institute of Flight System Dynamics (https://www.fsd.ed.tum.de/), Technische Universität München. They were developed as part of a case study on simulation-driven safety assessment that was performed during the EPUCOR project, with significant contributions from the following individuals: Julian Rhein (julian.rhein@tum.de), Barzin Hosseini (barzin.hosseini@tum.de), Hannes Hofsäß (hannes.hofsaess@tum.de), Franz Sax (franz.sax@tum.de). This work was partially funded by the federal government of Germany as part of the LuFo program (funding ID: 20Y1705C). The main case study on simulation-driven safety assessment that led to development of the dataset is published in [2], other work that contributed to the case study is published in [1], [3].
THIS DATASET IS PROVIDED BY THE COPYRIGHT HOLDERS AND CONTRIBUTORS "AS IS" AND ANY EXPRESS OR IMPLIED WARRANTIES, INCLUDING, BUT NOT LIMITED TO, THE IMPLIED WARRANTIES OF MERCHANTABILITY AND FITNESS FOR A PARTICULAR PURPOSE ARE DISCLAIMED. IN NO EVENT SHALL THE COPYRIGHT HOLDER OR CONTRIBUTORS BE LIABLE FOR ANY DIRECT, INDIRECT, INCIDENTAL, SPECIAL, EXEMPLARY, OR CONSEQUENTIAL DAMAGES (INCLUDING, BUT NOT LIMITED TO, PROCUREMENT OF SUBSTITUTE GOODS OR SERVICES; LOSS OF USE, DATA, OR PROFITS; OR BUSINESS INTERRUPTION) HOWEVER CAUSED AND ON ANY THEORY OF LIABILITY, WHETHER IN CONTRACT, STRICT LIABILITY, OR TORT (INCLUDING NEGLIGENCE OR OTHERWISE) ARISING IN ANY WAY OUT OF THE USE OF THIS DATASET, EVEN IF ADVISED OF THE POSSIBILITY OF SUCH DAMAGE.
References
[1] Hosseini, Seyedbarzin, Julian Rhein, Franz Sax, Hannes Hofsäß, Florian Holzapfel, Lukas Maier, Aaron Barth, and Benedikt Grebing. “Conversion of a Coaxial Rotorcraft to a UAV.” In AIAA SCITECH 2024 Forum. Orlando, FL: American Institute of Aeronautics and Astronautics, 2024. https://doi.org/10.2514/6.2024-1716.
[2] Rhein, Julian, Marco Bimbi, Giovanni Miraglia, and Florian Holzapfel. “Simulation-Driven Failure Modes and Effects Analysis of Flight Control System Architectures.” In 2024 AIAA DATC/IEEE 43rd Digital Avionics Systems Conference (DASC), 1–10, 2024. https://doi.org/10.1109/DASC62030.2024.10749685.
[3] Hofsäß, Hannes, Barzin Hosseini, Julian Rhein, and Florian Holzapfel. “On the Design and Model-Based Validation of Flight Control System Automation for an Unmanned Coaxial Helicopter,” 150–68. Gesellschaft für Informatik e.V., 2023. https://dl.gi.de/handle/20.500.12116/40201.