plotsomhits
R2026b(To be removed) Plot self-organizing map sample hits
plotsomhits will be removed in a future release. For more information,
see Transition Legacy Neural Network Code to dlnetwork Workflows.
For advice on updating your code, see Version History.
Syntax
plotsomhits(net,inputs)
Description
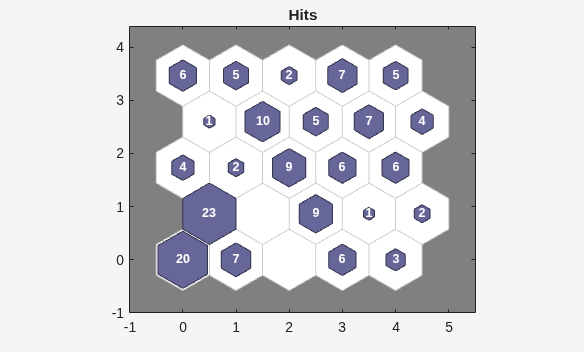
plotsomhits(net,inputs) plots a SOM layer, with
each neuron showing the number of input vectors that it classifies. The relative number of
vectors for each neuron is shown via the size of a colored patch.
This plot supports SOM networks with hextop and
gridtop topologies, but not tritop or
randtop.
Examples
Plot SOM Sample Hits
x = iris_dataset;
net = selforgmap([5 5]);
net = train(net,x);
plotsomhits(net,x)
Version History
Introduced in R2008aSee Also
Time Series Modeler | fitrnet (Statistics and Machine Learning Toolbox) | fitcnet (Statistics and Machine Learning Toolbox) | trainnet | trainingOptions | dlnetwork

