Write Timetable Data to TDMS File
This example shows how to write timetable data in various time channel layouts from MATLAB® to a TDMS file.
The MAT file provided with this example contains revolution and electrical current measurements for a circular saw in a scenario where it stops on detecting contact with skin.
Load the data to workspace.
load("sawstopper.mat")
whos
Name Size Bytes Class Attributes circular_saw_data 23572x2 378432 timetable
fileNameTCNone = "sawstopper_none.tdms";
fileNameTCSingle = "sawstopper_single.tdms";
channelGroup = "Circular Saw Data";
Write Timetable Without Time Channel
On specifying TimeChannel as "none", the start time and time step are added as properties of the channel. This time channel layout can be used only with a timetable that is regular in time, that is, with uniform time steps.
tdmswrite(fileNameTCNone, circular_saw_data, ChannelGroupName=channelGroup, TimeChannel="none");
info = tdmsinfo(fileNameTCNone);
info.ChannelListans=2×8 table
ChannelGroupNumber ChannelGroupName ChannelGroupDescription ChannelName ChannelDescription Unit DataType NumSamples
__________________ ___________________ _______________________ _____________________ __________________ ____ ________ __________
1 "Circular Saw Data" "" "Revolutions (1/min)" "" "" "Double" 47144
1 "Circular Saw Data" "" "Current (A)" "" "" "Double" 47144
The channel names in the TDMS file map to the original timetable variable names.
Use the tdmsreadprop function to inspect the start time (wf_start_time) and time step (wf_increment) of the data.
channel = info.ChannelList.ChannelName{1};
prop = tdmsreadprop(fileNameTCNone, ChannelGroupName=channelGroup, ChannelName=channel)prop=1×7 table
name description unit_string wf_start_time wf_start_offset wf_increment wf_samples
_____________________ ___________ ___________ _____________________________ _______________ ____________ __________
"Revolutions (1/min)" "" "" 2022-04-19 14:18:32.304446999 0 2.8e-06 23572
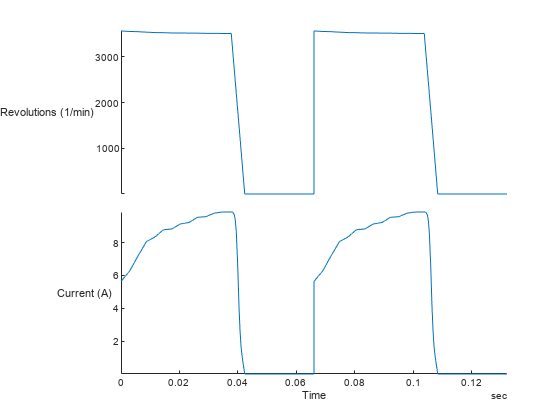
Read the data from the TDMS file and visually analyze the data using a stacked plot.
stackedplot(tdmsread(fileNameTCNone, TimeStep=seconds(prop.wf_increment)));
Write Timetable with Time Channel
By default, the time channel layout is TimeChannel="single", which means a time channel is created that contains a timestamp for every sample. Typically this time channel layout is useful when writing measurements that are irregular in time.
tdmswrite(fileNameTCSingle, circular_saw_data, ChannelGroupName=channelGroup, TimeChannel="single");Inspect the contents of the file. See that a time channel called "Time" is created, which is derived from the time column of the original timetable.
info = tdmsinfo(fileNameTCSingle);
info.ChannelList
ans=3×8 table
    ChannelGroupNumber     ChannelGroupName      ChannelGroupDescription         ChannelName         ChannelDescription    Unit     DataType      NumSamples
    __________________    ___________________    _______________________    _____________________    __________________    ____    ___________    __________

            1             "Circular Saw Data"              ""               "Time"                           ""             ""     "Timestamp"      47144
            1             "Circular Saw Data"              ""               "Revolutions (1/min)"            ""             ""     "Double"         47144
            1             "Circular Saw Data"              ""               "Current (A)"                    ""             ""     "Double"         47144
Read the data from the TDMS file, and visually analyze the data using a stacked plot with the time channel as the x-axis.
stackedplot(tdmsread(fileNameTCSingle, ChannelGroupName=channelGroup, RowTimes="Time"));