How to draw an histogram?
> How do I draw an histogram knowing the number of times all elements in a 150x150 matrix appears using matlab? Both histogram ...
mehr als 2 Jahre vor | 0
| akzeptiert
Given a contour plot is there a function which returns a matrix corresponding to the density of lines at a given (x,y) coordinate?
No, there is not a function that computes the density of contour lines. However, you could build such a function. First, you...
mehr als 2 Jahre vor | 1
| akzeptiert
Veröffentlicht
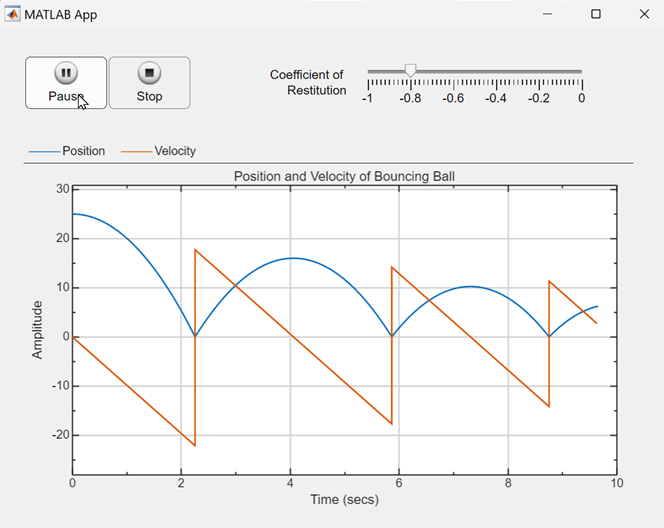
R2024a release: What’s new in Graphics and App Building?
There are dozens of new graphics and app building features in the MATLAB R2024a release. Here are some highlights to keep...
mehr als 2 Jahre vor
How to update vehicle's state variable in simulator?
I think the choice between the two options depends on a few factors. Relying on the state space equation (x'=Ax+Bu) involves c...
mehr als 2 Jahre vor | 0
Plotted patch changes size
Cause of the problem Indeed you are setting the patch location based on the ylimits but you are not setting the ylimits. After...
mehr als 2 Jahre vor | 1
| akzeptiert
Create mean y values by multiple groups in one graph
Use groupsummary to compute the means of each group. Then plot the results using bar() with categorical x values. This assumes...
mehr als 2 Jahre vor | 0
Plot a time series plot in customized rectangle
Previous answers suggest changing the size of the figure window which is one solution. Another solution is to set the size of...
mehr als 2 Jahre vor | 1
| akzeptiert
Generate 3D histogram while capping the height of bars
How to cap the height of a 2D histogram without affecting the max color for each bar This is tricky because hist3 does not retu...
mehr als 2 Jahre vor | 0
Change Colors of Multiple Objects Efficiently in AppDesigner with Switch
Looks like you're creating an exciting custom theme for your app @Brianna Billingsley! Here are some strategies to reduce the ...
mehr als 2 Jahre vor | 1
| akzeptiert
How to unfade legend placed on an empty (invisible) plot?
It's much better to use tiledlayout than subplot. With tiledlayout, the placement of the legend and the global title can be par...
mehr als 2 Jahre vor | 0
Discussion
Look at this graph......
Me at the beginning of every meeting https://www.youtube.com/watch?v=9NkkZJHova4
mehr als 2 Jahre vor | 4
Data not aligned after zooming into figure using plotyy
plotyy is not recommended. Instead, use yyaxis which replaces plotyy. I've converted your code below. yyaxis does not have th...
mehr als 2 Jahre vor | 2
| akzeptiert
"The MathWorks" or simply "MathWorks"?
According to this MathWorks Brand Guidelines page, use MathWorks to refer to the company. The legal name of the company is The ...
mehr als 2 Jahre vor | 1
Graph lines not showing
max_value_refA = max(out2.Q_i_ref); avg_value_refA = mean(out2.Q_i_ref); yline(max_value_refA, '--k') yline(avg_value_refAm...
mehr als 2 Jahre vor | 0
How to show multi data probability densities in one axes?
Plotting two binscatters in one axes This solution does the following: overlay two axes in tiledlayout link the axes limits ...
mehr als 2 Jahre vor | 0
Get quiver plot arrows to connect up contour lines
Let's break this down into steps. This solution doesn't address all of the requirements in the question. Get the arrows to s...
mehr als 2 Jahre vor | 0
How do I add transparency to a plot in the Live Editor?
When using RGBA values, the alpha value is not saved so when the figure loads, the color will lack transparency. Due to how fig...
mehr als 2 Jahre vor | 0
| akzeptiert
Plotting lines with quadruplets R-G-B-Alpha ?
> Is this documented anywhere? No, the 1x4 RGBA alpha-color option is not documented at this time. One reason is that the alp...
mehr als 2 Jahre vor | 0
| akzeptiert
Stacked Plots - Changing the Location and Oreintation of the Display Labels (Y Labels)
Y-axis label rotation in stackedplot is addressed here. You could use the same approach to change the YAxisLocation to the righ...
mehr als 2 Jahre vor | 0
Rotating text to 90 degrees
It looks like you're working with embedded text. You may find this resource helpful: https://peterscarfe.com/rotatingText.htm...
mehr als 2 Jahre vor | 0
A 2D circle divided into 10 sectors in the 3D plot.
Creating a polar heatmap within Cartesian coordinates The basic idea is to create a polar grid centered under the data, plotted...
mehr als 2 Jahre vor | 0
Put Y-Ticks above bars in stacked horizontal bar chart
Annotations are tricky because they rely on coordinates that are normalized to the figure area rather than using data units. I...
mehr als 2 Jahre vor | 0
Discussion
Create hyperlinks in the command window
The MATLAB command window isn't just for commands and outputs—it can also host interactive hyperlinks. These can serve as powerf...
mehr als 2 Jahre vor | 5
Disable figure generated code in Matlab R2023b
The subwindow you are describing only appears in the R2023b beta release found on the File Exchange. If you turn off the new de...
mehr als 2 Jahre vor | 1
| akzeptiert
Count percentage of certain number in struct
Looks like @Voss hit the nail on the head. Another approach is to use groupcounts to tally the counts between the two groups....
mehr als 2 Jahre vor | 1
Save matrix in matlab and call for operations
Two common approaches to storing a set of matrices are to store them in a cell array or, if the matrices are the same size, to s...
mehr als 2 Jahre vor | 0
| akzeptiert
How do I plot a timeseries?
Use readtimetable to create a timetable from your data file. If you're having problems with this step, provide a sample of your...
mehr als 2 Jahre vor | 0
How to include dependency in standalone app?
The MATLAB and Simulink compiler support page indicates that some functionality in the Audio Toolbox is not supported including ...
mehr als 2 Jahre vor | 0
| akzeptiert
Data Tips in parallelplot
The only way to add content to the datatip in parallelplot is to do so interactively by right-clicking the datatip in parallelpl...
mehr als 2 Jahre vor | 1
Dark Mode not working : R2023b Update 6 win64 on Windows 10 1903
After installing the update, you need to press the "Try the New Desktop" button at the top of the MATLAB desktop window.
mehr als 2 Jahre vor | 0