How do I get working y-axis errorbars using a log scale?
That looks like what happens if the bottom of the errorbar is negative. What do you get if you do this: h = errorbar(hp_...
fast 11 Jahre vor | 5
How to plot some 10 dimensional data point in a graph using MATLAB?
Making meaningful plots from higher-order multivariate data can be challenging. You might want to start by reading <http://www.m...
fast 11 Jahre vor | 1
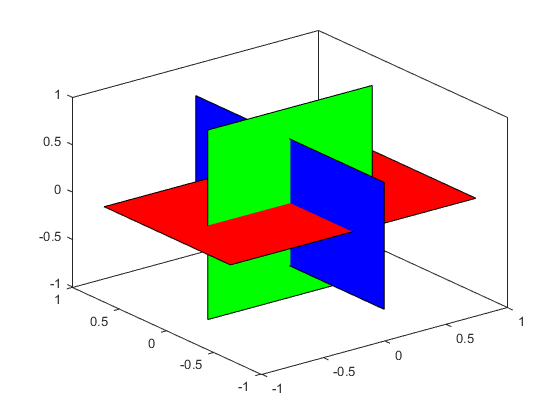
Filling area between two planes in 3d plot
The isosurface approach that Tim suggested is possible. Here's an example of how you'd do that. It's a bit involved and it uses ...
fast 11 Jahre vor | 0
| akzeptiert
Linestyles & Marker styles when plotting a matrix
It's hard to do that in the plot command, but the set command can do it: h = plot(magic(3)); set(h,{'Marker'},{'+';'s';'...
fast 11 Jahre vor | 5
| akzeptiert
get mesh from surf function
Yes, the <http://www.mathworks.com/help/matlab/ref/surf2patch.html surf2patch> command. [x,y,z] = peaks(10); h = surf(x,...
fast 11 Jahre vor | 0
| akzeptiert
Veröffentlicht
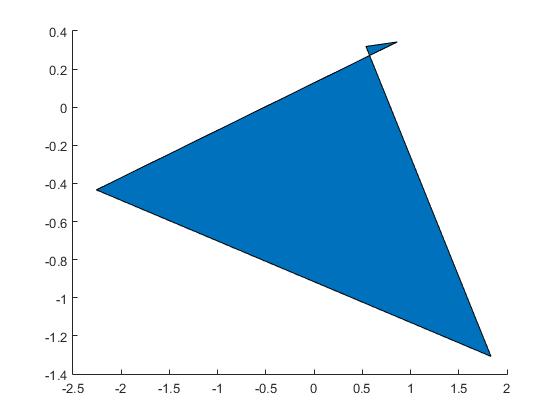
Tiling Quadrilaterals
Tiling QuadrilateralsLast time I was talking about the new pentagon tiling which was recently discovered. There are lots of...
fast 11 Jahre vor
Fixing Contour Plot/ Smooting Contour plot
I talked a bit about the interpolation technique that surface uses in <http://blogs.mathworks.com/graphics/2014/11/18/what-is-a-...
fast 11 Jahre vor | 0
| akzeptiert
Slicing 3D model data without using griddata
You're inserting your data points into a 3D grid and then pulling a 2D slice out of that grid. That could make sense if you want...
fast 11 Jahre vor | 1
Help plotting equations in 3D
Actually, I feel like we're missing a piece of the question here. In your code, meshgrid and peaks(6284) are creating 2D arra...
fast 11 Jahre vor | 0
| akzeptiert
four points grid interpolation function
Probably interp2 with linear, but I discussed some of the details in <http://www.mathworks.com/matlabcentral/answers/235861-four...
fast 11 Jahre vor | 0
| akzeptiert
I used plot3. when I try to rotate the 3D image, it is too slow to rotate for each time.
I'm guessing that widthl and hightl are fairly large. This means that you're creating a large number of objects which are each d...
fast 11 Jahre vor | 0
MATLABR2015a Opengl issue
There are a number of different things going on here. 1) The bench program is only for comparing different machines with the ...
fast 11 Jahre vor | 0
Issue with long titles printing in 300 dpi on Matlab 2014b
If you call opengl info there's a value in the output named MaxTextureSize. My guess is that this is really low on y...
fast 11 Jahre vor | 1
Excessive ram usage when plotting using 2014b 64bit
I can't guess what you're seeing without more details, but the memory consumption of MATLAB Graphics often tracks pretty closely...
fast 11 Jahre vor | 0
Veröffentlicht
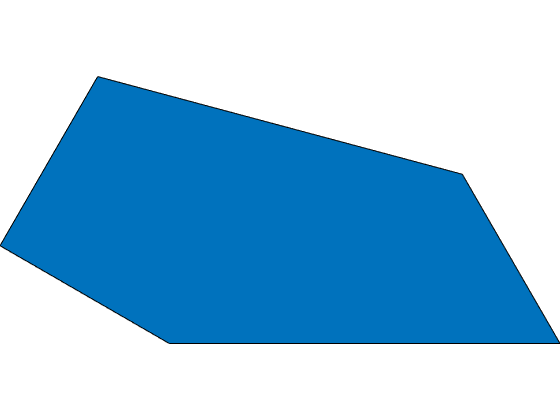
Type 15 Convex Pentagon
Like most computer graphics programmers, I've always been fascinated by the different types of regular tilings of the plane....
fast 11 Jahre vor
3D matrix rotations to make two matrices have the same 3D direction cosines
Usually the best way to think about this is as rotation about an axis. Consider this example: origin = [0 0 0]; pt1 = ra...
fast 11 Jahre vor | 1
| akzeptiert
Rotating 3D plots can produce reflections?
I think that's just an optical illusion because of the orthographic projection. Here's what I get if I load them and add so...
fast 11 Jahre vor | 2
| akzeptiert
How to draw orthogonal lines ?
I'm afraid I don't understand the question "why am i getting negative axis". The length of the orthogonal lines goes at the p...
fast 11 Jahre vor | 0
I have drawn a 3D plot in matlab, but I need the code so that the each marker of the plot has different colors, normally markers has only one color for all ,but I need different markers with different colors?
The plot3 command won't do a separate color per vertex, but you can use hold to add a scatter to your plot: theta = linspac...
fast 11 Jahre vor | 0
How to draw orthogonal lines ?
Let's say we have the following line: pt1 = 10*randn(1,2); pt2 = 10*randn(1,2); line([pt1(1), pt2(1)],[pt1(2),pt2(2)]...
fast 11 Jahre vor | 0
Create colorbar for custom colormap used in Scatter?
Colorbar can't do this because you've already converted your data values into RGB. Since your scatter object doesn't have the or...
fast 11 Jahre vor | 0
Counitng the number of scatter points above a surface
You can use interp2 to evaluate the surface at the X & Y coordinates of your scatter data. Consider the following example: ...
fast 11 Jahre vor | 1
| akzeptiert
From 2014 to 2015 Matlab Versions I am now unable to display my annotation textbox in a uipanel. How can I display it on top of the uipanel?
It sounds like it's probably <http://www.mathworks.com/matlabcentral/answers/157880-why-are-some-components-missing-or-partially...
fast 11 Jahre vor | 0
| akzeptiert
How do i get evenly spaced marks in my plots?
I think YC is asking how to place markers evenly on the curve, rather than the kind of fine tuning that AlignVertexCenters does....
fast 11 Jahre vor | 1
Veröffentlicht
Transparency in 3D
Transparency in 3DTransparency is a very useful feature when creating pictures in 3D. But there are a suprising number of...
fast 11 Jahre vor
how to plot an arrow given yaw/pitch/roll
Consider the following simple example: pt = [0 0 0]; dir = [1 0 0 1]; h = quiver3(pt(1),pt(2),pt(3), dir(1),dir(2),di...
fast 11 Jahre vor | 2
| akzeptiert
Why does FaceAlpha affect ZData of different object?
There are some interesting interactions between transparency and depth sorting. You're encountering them here. At this point ...
fast 11 Jahre vor | 2
| akzeptiert
How can I change the x-axis limit of recovered signal so that it becomes equal to x axis limit of input sampled sequence?following plots are as follows?
By default, the axis gets padded out to get nice round numbers for the ticks and make sure there are ticks at the ends. The comm...
fast 11 Jahre vor | 0
| akzeptiert
Hello... I want to get a diagonal cross section cut of the mesh plot. and want to get a 2D plot which have 1.) z axis of mesh plot nd 2.)Diagonal of the X and Y axis of mesh plot.Can anyone suggest me how can i do that.?? plz..need the solution ASAP.
The problem I described in <http://blogs.mathworks.com/graphics/2015/07/22/implicit-surface-intersections/ this blog post> was a...
fast 11 Jahre vor | 1
| akzeptiert
I need to draw a line on a globe from an anchor point to another point derfined by the cursor location. As I move the cursor to a new point I need to erase the first line and draw a new one. How do I use animated line to do this?
I'm not sure what gcarc is or what the context is, but I'm assuming that you're inside a loop here. If so, you'd want something ...
fast 11 Jahre vor | 0
| akzeptiert