Plotting Two Data Sets on a Figure

3 Ansichten (letzte 30 Tage)
Hollis Williams
Hollis Williams am 24 Mär. 2020
Kommentiert: Cris LaPierre am 3 Apr. 2020
I have two sets of data which can be plotted as a sets of discrete points given by (x,y) coordinates on a 2D plot. Is there some way that I can manually plot both sets of points, join the points to have two separate curves for the two data sets and then have a legend corresponding to the points used for the plotting? If easier, I could enter the data sets as arrays by creating the matrix and then plotting from it.
I did something similar before in this case it was something like a scatter diagram whereas here I need to join the points.

Akzeptierte Antwort

Cris LaPierre
Cris LaPierre am 24 Mär. 2020
Something like this?
Use the hold command.
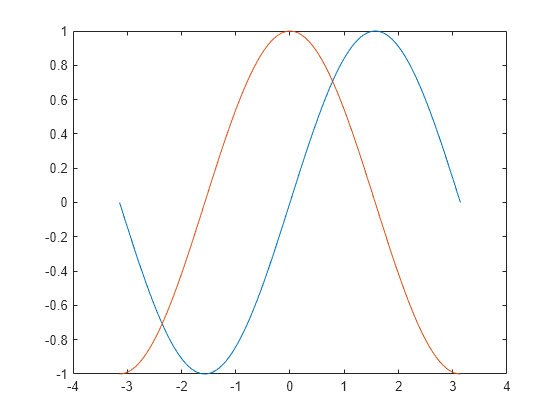
x = linspace(-pi,pi);
y1 = sin(x);
plot(x,y1)
hold on
y2 = cos(x);
plot(x,y2)
hold off
  10 Kommentare
Hollis Williams
Hollis Williams am 3 Apr. 2020
I did try this but it does not produce anything on the figure, I think the trouble is that I am plotting points one-by-one manually rather than creating a curve in the first place. I am just wondering if there is some way to plot all the points as dashes such that each dash points towards the next point and you end up with a dashed curve.
Cris LaPierre
Cris LaPierre am 3 Apr. 2020
Bad example. Sorry. Yes, line styles don't apply if you are plotting the points one at a time. You'll need to use a marker. Check out the link I shared. That shows you the available marker styles.

Melden Sie sich an, um zu kommentieren.

Weitere Antworten (0)

Produkte


Version

R2019b

Community Treasure Hunt

Find the treasures in MATLAB Central and discover how the community can help you!

Start Hunting!

Translated by