Visualisieren Sie den einfachen gleitenden Durchschnitt Ihrer Daten
Dieses Beispiel zeigt, wie man den einfachen gleitenden Durchschnitt eines Aktienkurses im Zeitverlauf berechnet und die Ergebnisse visualisiert.
Daten lesen
ThingSpeak™ Kanal 276806 enthält Finanzdaten mit Zeitverzögerung. Die Daten werden alle fünf Minuten erfasst. Die ersten sechs Felder enthalten Preis- und Zahlendaten für den letzten, höchsten, niedrigsten, Volumen-, Eröffnungs- und Schlusswert. Lesen Sie die Daten mit der Funktion thingSpeakRead aus dem Kanal 276806 an einem bestimmten Tag, beispielsweise dem 4. Januar 2018.
data = thingSpeakRead(276806,'DateRange',[datetime('January 3, 2019 0:0:0') datetime('January 4, 2019 0:0:0')],'Fields',1,'outputFormat','timetable');
Berechnen Sie den einfachen gleitenden Durchschnitt
Verwenden Sie die Funktion movavg, um den einfachen gleitenden Durchschnitt zu berechnen. Legen Sie die Verzögerung auf 6 fest, was die Fenstergröße oder Anzahl der Perioden für den gleitenden Durchschnitt angibt. Die Fenstergröße von 6 entspricht 30 Minuten Daten. Das Standardverhalten für movavg ist ungewichtet oder ein einfacher gleitender Durchschnitt.
lag = 6;
simple = movavg(data.Last,'simple',lag);
Stelllen Sie den gleitenden Durchschnitt dar
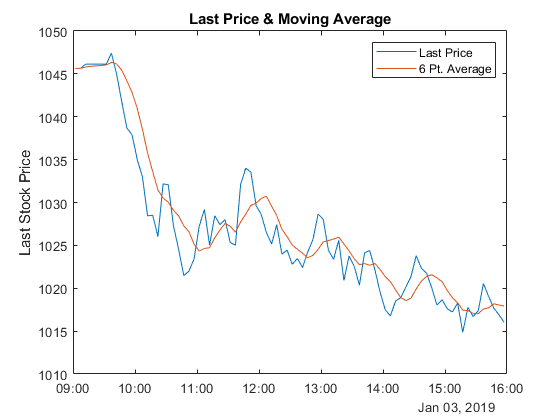
Stellen Sie die einfachen gleitenden Durchschnittsberechnungen für Aktienkurswerte im Zeitverlauf grafisch dar.
plot(data.Timestamps,data.Last, data.Timestamps,simple);
legend('Last Price','6 Pt. Average');
ylabel('Last Stock Price');
title('Last Price & Moving Average');

Das Diagramm zeigt den Aktienkurs und den gleitenden Durchschnitt des Aktienkurses im Laufe eines Tages.
Siehe auch
Funktionen
thingSpeakRead|movavg(Financial Toolbox)