Cursor Measurements
Enable data cursors to measure the difference in time (x-axis) and signal amplitude (y-axis), rate of change of the signal, and slope of the signal.
To enable the cursors, click the Data Cursors button
(![]() ) in the Measurements tab of the
scope toolstrip. Under Data Cursors, select the type of cursors and the
corresponding Cursor Settings.
) in the Measurements tab of the
scope toolstrip. Under Data Cursors, select the type of cursors and the
corresponding Cursor Settings.
Note
If a data point in your signal has more than one value, the cursor measurement at that point is undefined and the scope does not display any cursor values.
Type of Cursors
Cursor measurements include the following two types of cursors:
Waveform Cursors –– Waveform cursors are vertical cursors that track the signal.
Screen Cursors –– Screen cursors are both horizontal and vertical cursors that you can place anywhere in the display.
To modify the type of cursors to display, click the drop-down arrow under Data Cursors and select Waveform Cursors or Screen Cursors.
Cursor Settings
To access the cursor settings, click the drop-down arrow under Data Cursors and click Cursor Settings. In the settings, you can select to display horizontal or vertical cursors, specify the position of the cursors, lock the spacing between the cursors, show the cursors panel and measurements. When more than one signal is displayed, you can assign cursors to trace each signal individually.
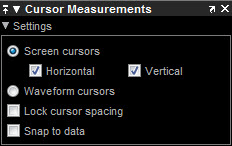
Horizontal –– Select to display horizontal screen cursors. Enabled only when you display the Screen Cursors.
Vertical –– Select to display vertical screen cursors. Enabled only when you display the Screen Cursors.
Snap to Data — Positions the cursors on signal data points.
Lock Cursor Spacing — Locks the frequency difference between the two cursors.
Show Panel — Show the cursor measurements panel at the bottom of the display.
Show Measurement — Show the Δsecs and ΔValue cursor measurements on the signal display.
Cursors Panel
The Cursors measurements panel displays time and signal amplitude value measurements.

1 — View or modify the time or value at the cursor identified by the number 1 (solid line cursor).
2 — View or modify the time or value at the cursor identified by the number 2 (dashed line cursor).
ΔT or ΔX or Δsecs — Show the absolute value of the time (x-axis) difference between the cursors identified by the numbers 1 and 2.
ΔY or ΔValue — Show the absolute value of the signal amplitude difference between the cursors identified by the numbers 1 and 2.
1/ΔT or 1/ΔX — Show the rate or the reciprocal of the absolute value of the difference in the times (x-axis) between the cursors identified by the numbers 1 and 2.
ΔY/ΔT or ΔY/ΔX — Show the slope or the ratio of the absolute value of the difference in signal amplitudes between cursors to the absolute value of the difference in the times (x-axis) between cursors.