Plot Component Data on Z Smith Chart Using General Amplifier Block
This example shows how to:
Plot component data on a Z Smith Chart using a General Amplifier Block form Equivalaent Baseband library.
Simulate the frequency response of an amplifier using data from the default.s2d S2D file.
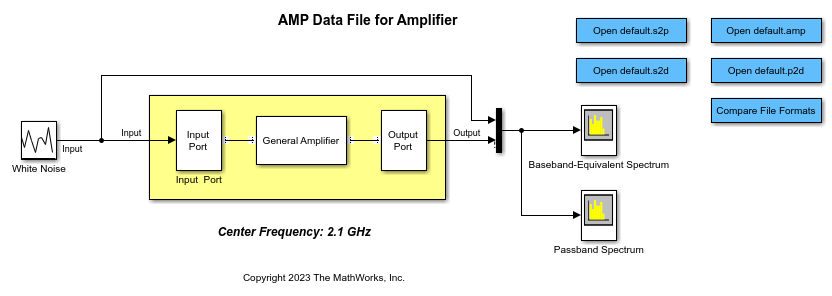
Using a RF Blockset Equivalent Baseband example model, you import the data file into a General Amplifier block and validate the amplifier by plotting the S-parameters of the block on a Z Smith Chart. Open the AMP Data File for Amplifier example.
open_system("sparam_amp_rfblks.slx")

Double-click the General Amplifier block to display its parameters. Set Data source parameter to Data file and Data file parameter to default.s2d. These values tell the RF Blockset to import data from the file default.s2d. The block uses this data, along with the other block parameters, in simulation.
Select the Visualization tab and set the General Amplifier block parameters as follows:
In the Plot type list, select
Z Smith chart.In the Y Parameter1 list, select
S22.
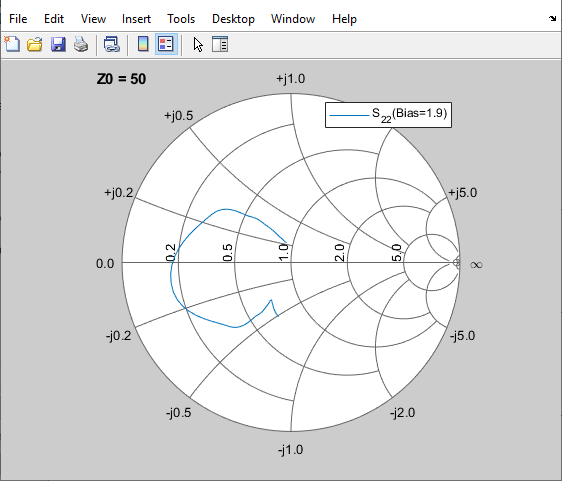
Click Plot. This action creates a Z Smith Chart of the S22 parameters using the frequency data from the default.s2d file.
