Scan Tumor Growth Using Group-Specific Doses and Variant Parameters from Data Set
The SimBiology Model Analyzer app lets you specify quantity samples from your data set and scan your model using such values. For instance, if the data set has data columns with group-specific dose amounts and alternate parameter values (variants), the app lets you specify them to apply to each group during simulation. The following steps illustrate how to scan a tumor growth model using doses and variants specified in a data set.
Load Tumor Growth Model and Data
Enter the following command to load the tumor growth model and data in SimBiology Model Analyzer.
openExample('simbio/ScanDosesVariantsFromDataSimBiologyModelAnalyzerExample')
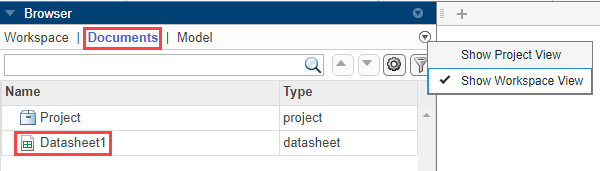
In the Browser pane (if it is in the default Project View), expand the Data1 folder and double-click Datasheet1 to open the data set.
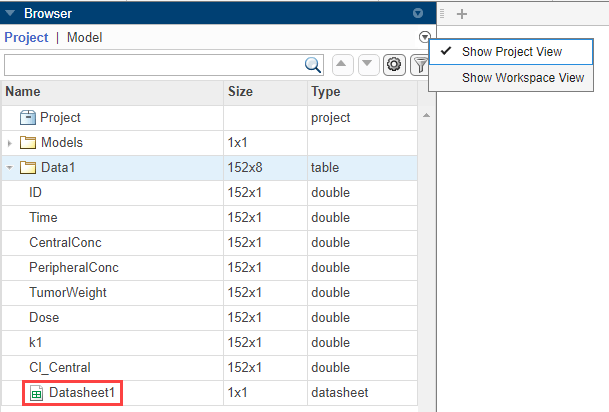
If your browser is in the Workspace View, click Documents and double-click Datasheet1 instead.
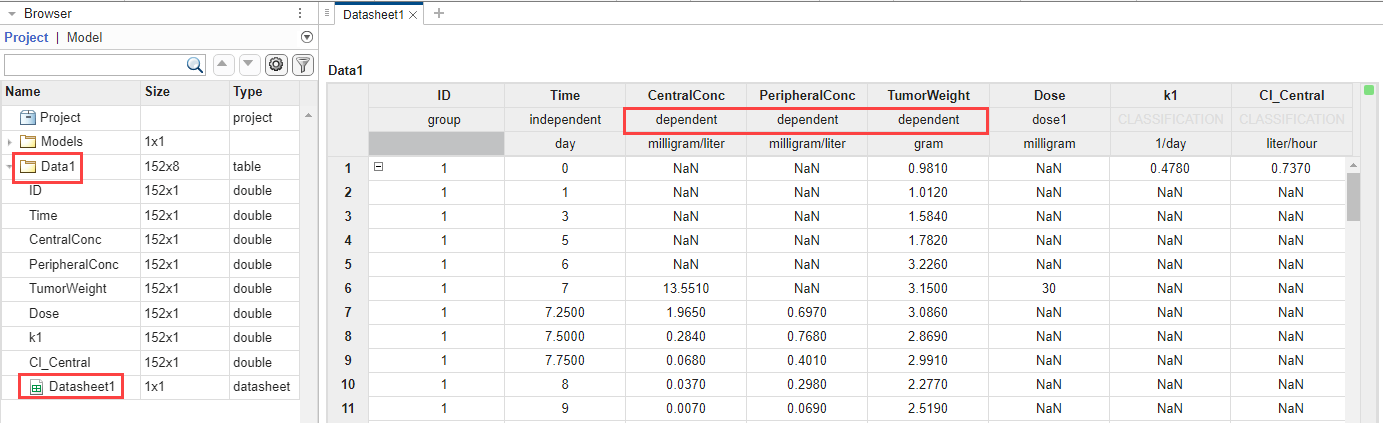
The app automatically classifies the following columns:
The ID column as group (a grouping variable).
The Time column as independent (an independent variable).
The Dose column as dose1 (a dosing variable). If the data has more than one dose columns, you can classify them as dose2, dose3, and so on.
For the measured response data columns such as CentralConc, you need to manually classify them as the dependent variables. Double-click Classification under CentralConc and select dependent. A dependent variable is a response that is time-varying.
Repeat the same process for PeripheralConc and TumorWeight.
Tip: The data set also contains two variant columns k1 and Cl_Central, which contain group-specific values for the parameters k1 and Cl_Central. Optionally, you may classify them as covariate. A covariate is a value that a response may depend on and could be used as a category variable in plotting, for instance. For details on setting up group-specific variant columns, see variableNames.
Set up the Run Scan Program Using Doses and Variants from Data Set
Select Program > Run Scan to open the program. The Model step of the program has been prepopulated with Tumor Growth Model.
In the Generate Samples step, do the following.
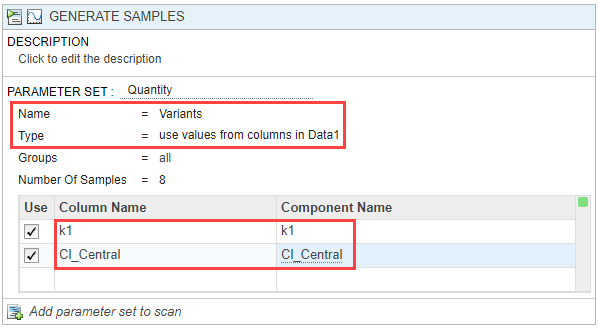
1. Under Parameter Set, use the default value Quantity but change Type to use values from columns in Data1 to to set up group-specific variants from data. Also, change Name to Variants.
2. Double-click the empty cell under Column Name and enter k1. Also, enter k1 for Component Name. If all values of a variable within a group are NaN, the program creates no entry in the variant content for the group. When you simulate the model with the variant in the Simulation step later, the program uses the associated model component value as the initial value for model simulation.
3. Similarly, enter Cl_Central in the next row.
4. Next, set up group-specific doses from data. Click Add parameter set to scan.
5. For Parameter Set, change from Quantity to Dose. Change Name to Doses.
6. Change Type to create doses from columns in Data1.
7. Double-click the empty cell under Column Name and enter Dose.
8. Set Target Name to Central.Drug. Keep the amount tunits and time units unchanged.
9. Near the top of Generate Samples step, under Parameter Set Combinations, double-click the grid icon ![]() and change to elementwise to match the variants and doses for each group specified in the data set.
and change to elementwise to match the variants and doses for each group specified in the data set.
10. Disable the sample plot generation by clicking the corresponding icon ![]() at the top of the step.
at the top of the step.
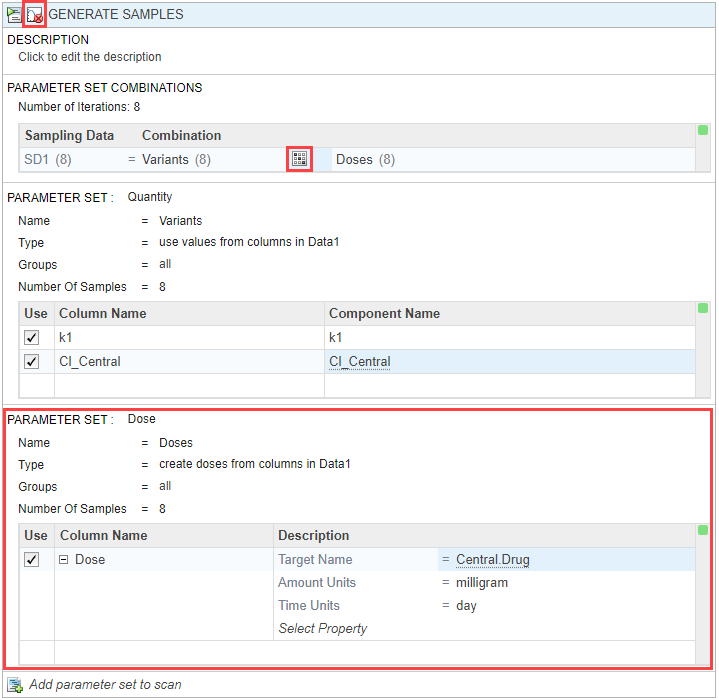
The program is now set up to scan the model by simulating eight groups using the group-specific doses and variants specified in the data set.
Scan Tumor Growth
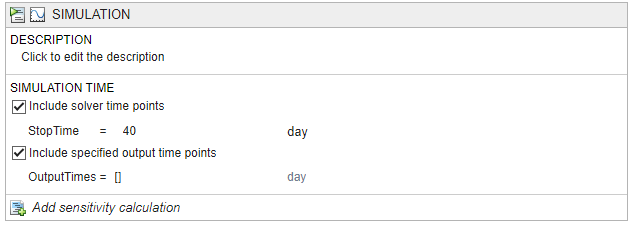
In the Simulation step, under the Simulation Time section, you can edit the settings for simulation time. For this example, keep the default settings.
Click Run on the Home tab to simulate the tumor growth response for each group specified in the data set. The program generates the following time plot after simulation.
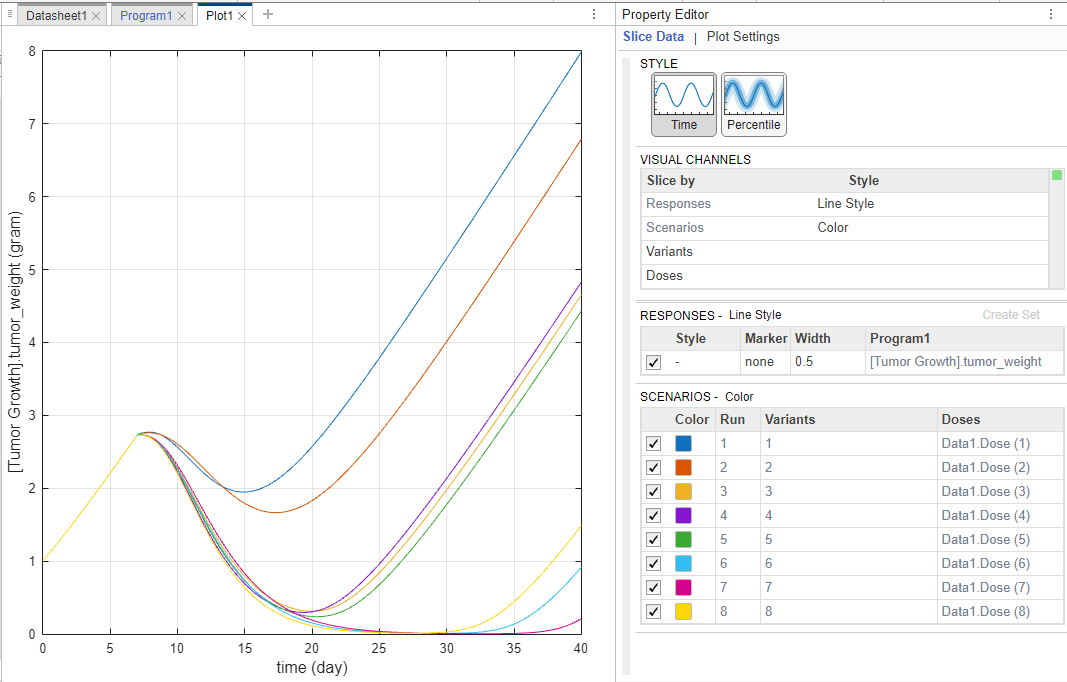
There are eight runs, where each run is the simulated tumor growth for the corresponding group using group-specific variants and doses.
See Also
SimBiology Model Builder | SimBiology Model Analyzer