Call Hierarchy in Polyspace Access Web Interface
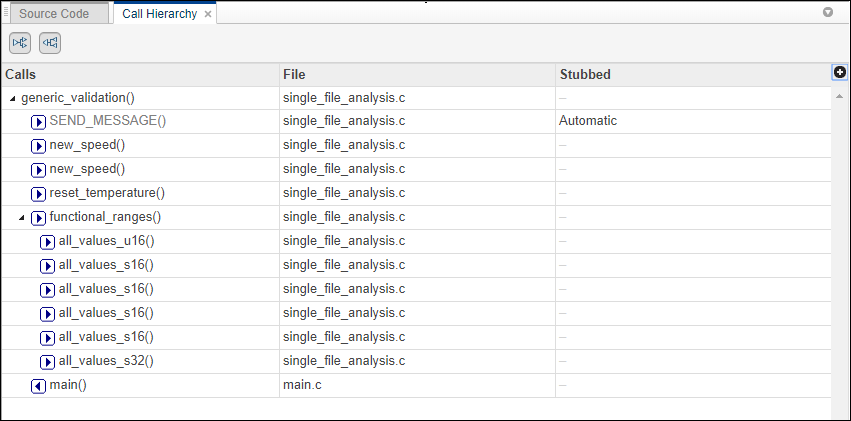
The Call Hierarchy pane displays the call tree of functions in the source code.
For each function foo, the Call Hierarchy pane
lists the functions and tasks that call foo (callers) and those
called by foo (callees). The callers are indicated by ![]() . The callees are indicated by
. The callees are indicated by ![]() . The Call Hierarchy pane lists
direct function calls and indirect calls through function pointers.
. The Call Hierarchy pane lists
direct function calls and indirect calls through function pointers.
Note
For Polyspace® Access™ findings, you might not see all callers or callees of a function, especially for calls through function pointers and dead code.
For instance, Polyspace
Access does not display the functions registered with
at_exit() and at_quick_exit(), and called
by exit() and quick_exit() respectively.
You open the Call Hierarchy pane by using the ![]() icon in your Results Details
pane, or by going to Window > Call Hierarchy.
icon in your Results Details
pane, or by going to Window > Call Hierarchy.
To update the pane, click a defect on the Results List or CTRL-click a result in the Source Code pane. You see the function containing the defect with its callers and callees.
In this example, the Call Hierarchy pane displays the function
generic_validation, and with its callers and callees.
Tip
To navigate to the call location in the source code, select a caller or callee name
In the Call Hierarchy pane, you can perform these actions: