Creating 3-D Plots
This example shows how to create 3-D line plots in MATLAB using the plot3 function.
Create a regularly-spaced vector t from 0 to 10*pi using pi/50 as the increment between elements.
t = 0:pi/50:10*pi;
Calculate sine for each value in t.
st = sin(t);
Calculate cosine for each value in t.
ct = cos(t);
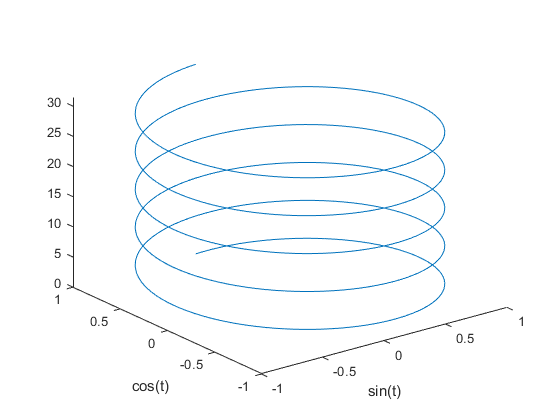
Use the 'plot3' function to display a three-dimensional plot of a set of data points.
figure;
plot3(st, ct, t)
xlabel('sin(t)')
ylabel('cos(t)')