Changing Surface Properties
This example shows how to get properties of a surface plot in MATLAB® and change the property values to customize your plot.
Surface Objects
There are several ways to create a surface object in MATLAB. One way is to use surf.
[X,Y,Z] = peaks(50);

figure
surf(X,Y,Z)
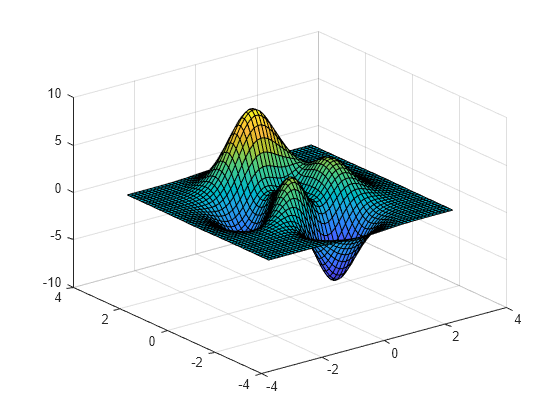
Like all graphics objects, surfaces have properties that you can view and modify. These properties have default values. The display of the surface object, s, shows the most commonly used surface properties, such as EdgeColor, LineStyle, FaceColor, and FaceLighting.
s = surf(X,Y,Z)

s =
  Surface with properties:

       EdgeColor: [0.1294 0.1294 0.1294]
       LineStyle: '-'
       FaceColor: 'flat'
    FaceLighting: 'flat'
       FaceAlpha: 1
           XData: [50×50 double]
           YData: [50×50 double]
           ZData: [50×50 double]
           CData: [50×50 double]

  Show all properties
Get Individual Surface Properties
To access individual properties, use dot notation syntax object.PropertyName. For example, return the FaceColor property of the surface.
s.FaceColor
ans =
'flat'
Change Commonly Used Surface Properties
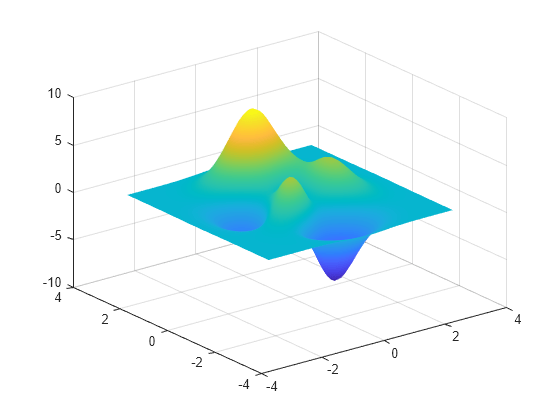
Several functions are available to change surface properties. For example, use the shading function to control the shading of your surface.
shading interp % interpolate the colormap across the surface face
Use the lighting function to adjust the lighting characteristics of your surface. In order for lighting to have any affect, you must light your surface by creating a light object.
light               % create a light
lighting gouraud    % preferred method for lighting curved surfaces

To change the reflectance property of your surface, use the material function.
material dull % set material to be dull, no specular highlights

To set the transparency for all objects in the current axes, use the alpha function. This function sets the transparency to any value between 1 and 0, where 1 means fully opaque and 0 means completely transparent.
alpha(0.8) % set transparency to 0.8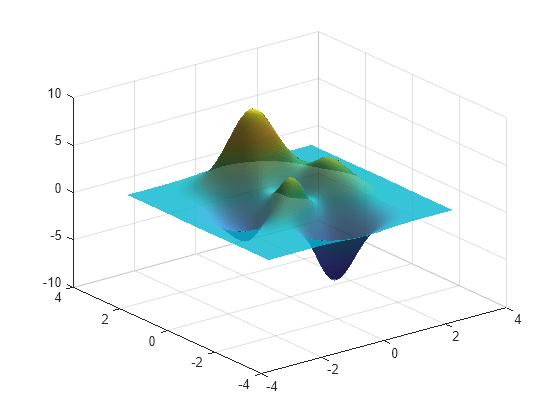
Change Other Surface Properties
To customize the look of your surface, change property values using dot notation.
CData defines the colors for the vertices of the surface. The FaceColor property indicates how the colors of the surface faces are determined from the vertex colors.
s.CData = hypot(X,Y); % set color data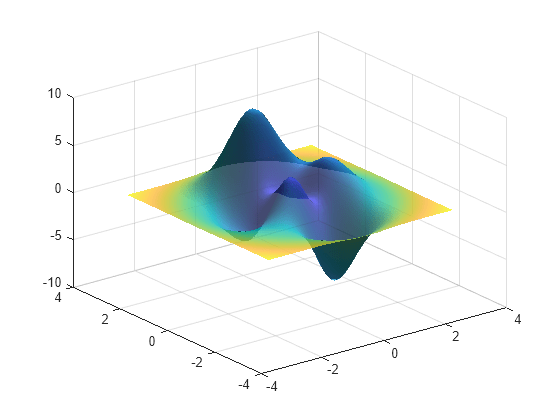
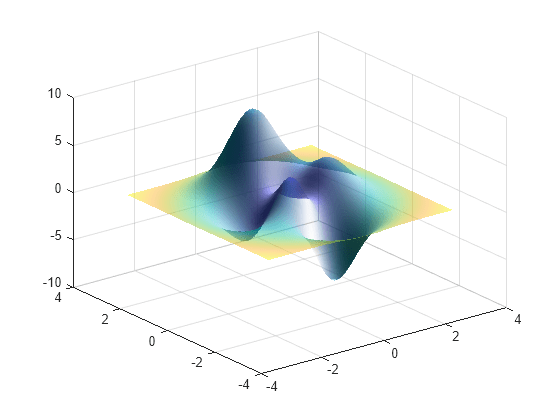
s.FaceColor = 'interp'; % interpolate to get face colors
AlphaData defines the transparency for each vertex of the surface. The FaceAlpha property indicates how the transparency of the surface faces are determined from vertex transparency.
s.AlphaData = gradient(Z);    % set vertex transparencies
s.FaceAlpha = 'interp';       % interpolate to get face transparencies
Get All Surface Properties
Graphics objects in MATLAB have many properties. To see all the properties of a surface, use the get command.
get(s)
          AlignVertexCenters: off
                   AlphaData: [50×50 double]
            AlphaDataMapping: 'scaled'
             AmbientStrength: 0.3000
                  Annotation: [1×1 matlab.graphics.eventdata.Annotation]
            BackFaceLighting: 'reverselit'
                BeingDeleted: off
                  BusyAction: 'queue'
               ButtonDownFcn: ''
                       CData: [50×50 double]
                CDataMapping: 'scaled'
                   CDataMode: 'manual'
                 CDataSource: ''
                    Children: [0×0 GraphicsPlaceholder]
                    Clipping: on
                 ContextMenu: [0×0 GraphicsPlaceholder]
                   CreateFcn: ''
             DataTipTemplate: [1×1 matlab.graphics.datatip.DataTipTemplate]
                   DeleteFcn: ''
             DiffuseStrength: 0.8000
                 DisplayName: ''
                   EdgeAlpha: 1
                   EdgeColor: 'none'
                EdgeLighting: 'none'
                   FaceAlpha: 'interp'
                   FaceColor: 'interp'
                FaceLighting: 'gouraud'
                 FaceNormals: [49×49×3 double]
             FaceNormalsMode: 'auto'
            HandleVisibility: 'on'
                     HitTest: on
               Interruptible: on
                   LineStyle: '-'
                   LineWidth: 0.5000
                      Marker: 'none'
             MarkerEdgeColor: 'auto'
             MarkerFaceColor: 'none'
                  MarkerSize: 6
                   MeshStyle: 'both'
                      Parent: [1×1 Axes]
               PickableParts: 'visible'
                    Selected: off
          SelectionHighlight: on
    SpecularColorReflectance: 1
            SpecularExponent: 10
            SpecularStrength: 0
                         Tag: ''
                        Type: 'surface'
                    UserData: []
               VertexNormals: [50×50×3 double]
           VertexNormalsMode: 'auto'
                     Visible: on
                       XData: [50×50 double]
                   XDataMode: 'manual'
                 XDataSource: ''
                       YData: [50×50 double]
                   YDataMode: 'manual'
                 YDataSource: ''
                       ZData: [50×50 double]
                 ZDataSource: ''