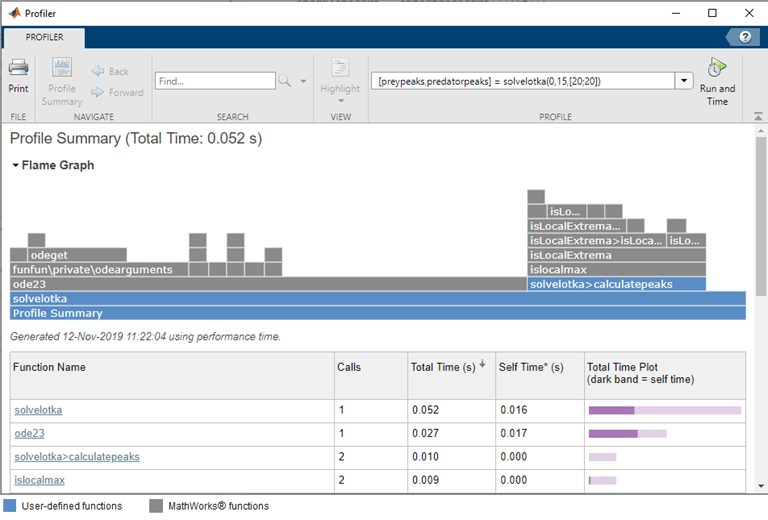
Profiler
Run code and measure execution time to improve performance
Description
The Profiler app enables you to profile your code interactively. Profiling is a way to measure the time it takes to run your code and identify where MATLAB® spends the most time. After you identify which functions are consuming the most time, you can evaluate them for possible performance improvements.
You also can profile your code to determine which lines of code do not run. Determining which lines of code do not run is useful when developing tests for your code, or as a debugging tool to help isolate a problem in your code.
Open the Profiler App
MATLAB Toolstrip: On the Apps tab, under MATLAB, click the app icon.
MATLAB Command Prompt: Enter
profile viewer.
Version History
Introduced before R2006a
