Interactively Plot Points and Lines on Geographic Globes
R2026bUnlike geographic axes, geographic globes do not support the
ginput function. To interactively identify the coordinates of a
location on a geographic globe, you must query the CurrentPoint
property of the globe object. This topic shows how to interactively plot points and
lines on a globe by defining figure callback functions that use the
CurrentPoint property. For more information about callbacks,
see Create Callbacks for Graphics Objects.
Plot Points
Plot a marker on the globe each time you select a location.
Create a geographic globe. To prevent new markers from replacing existing markers, set the hold state of the globe to "on". Navigate to a mountainside in Massachusetts by changing the position and rotation angles of the camera.
uif = uifigure;
g = geoglobe(uif);
hold(g,"on")

campos(g,42.6351,-73.1775,1100)
campitch(g,-25)
camheading(g,75)
Define a callback function that plots a marker at the location stored in the CurrentPoint property. Then, assign the callback to the WindowButtonDownFcn property of the parent figure. The callback executes each time you click a mouse button while the pointer is in the figure window. When you specify a callback using WindowButtonDownFcn, interactions such as panning and zooming do not affect the view of the globe.
function plotMarkerOnClick(~,~,g)
lat = g.CurrentPoint(1);
lon = g.CurrentPoint(2);
geoplot3(g,lat,lon,1,HeightReference="terrain", ...
    Marker="o",MarkerSize=12,MarkerFaceColor="#00A9E0",MarkerEdgeColor="none");
end

g.Parent.WindowButtonDownFcn = @(src,event)plotMarkerOnClick(src,event,g);
Click multiple locations on the globe. Each click adds a new marker.
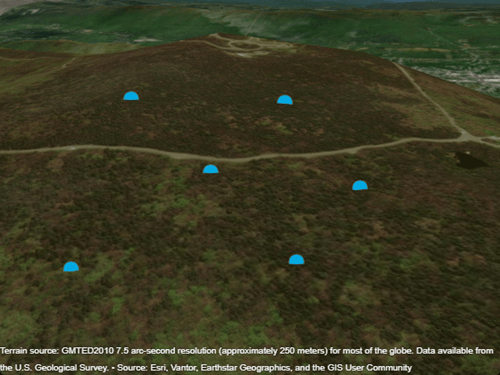
If you click outside the planet, such as on the black background, CurrentPoint returns NaN values. In this case, the callback executes, but a marker does not appear on the globe.
Plot Lines
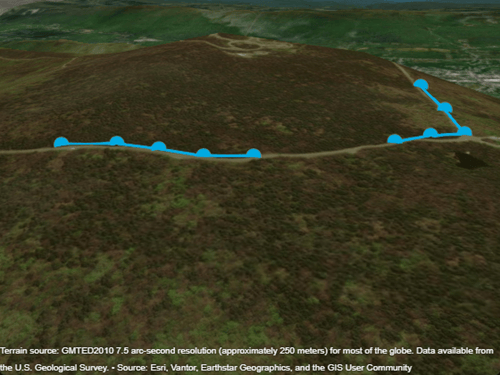
Plot markers by left-clicking, then connect the markers with a line by right-clicking.
Create a geographic globe. To prevent new markers from replacing existing markers, set the hold state of the globe to "on". Navigate to a mountainside in Massachusetts by changing the position and rotation angles of the camera.
uif = uifigure;
g = geoglobe(uif);
hold(g,"on")

campos(g,42.6351,-73.1775,1100)
campitch(g,-25)
camheading(g,75)
Define a callback function that uses the SelectionType property of the parent figure to distinguish between left clicks and right clicks. On a left click, the callback plots a marker and stores the coordinates in the UserData property of the globe. On a right click, the callback connects the stored points into a line and clears UserData so you can start a new line.
function plotMarkersThenLine(~,~,g)
parent = g.Parent;
% Left click
if parent.SelectionType == "normal"
    if isempty(g.UserData)
        g.UserData = [];
    end
    g.UserData(end+1,:) = g.CurrentPoint;
    geoplot3(g,g.UserData(end,1),g.UserData(end,2),1,HeightReference="terrain", ...
        Marker="o",MarkerSize=12,MarkerFaceColor="#00A9E0",MarkerEdgeColor="none");
    % Right click
elseif parent.SelectionType == "alt"
    if ~isempty(g.UserData)
        geoplot3(g,g.UserData(:,1),g.UserData(:,2),1,HeightReference="terrain", ...
            Color="#00A9E0",LineWidth=2);
        g.UserData = [];
    end
end
end
Assign the callback to the WindowButtonDownFcn property of the parent figure. The callback executes each time you click a mouse button while the pointer is in the figure window. When you specify a callback using WindowButtonDownFcn, interactions such as panning and zooming do not affect the view of the globe.
g.Parent.WindowButtonDownFcn = @(src,event)plotMarkersThenLine(src,event,g);
Add multiple markers to the globe by left-clicking. Connect the markers with a line by right-clicking. After you add the line, you can start adding markers for a new line.