Display Basemap Images on Maps
When you create maps using geographic axes, you can specify a basemap by using the geobasemap function or by setting the Basemap property of the geographic axes object. To use basemaps with map axes, axesm-based maps, or Cartesian axes, you can first read an image from a basemap by using the readBasemapImage function and the name of any basemap supported by the geobasemap function. Then, you can display the basemap image on the map.
This example shows how to read and display basemap images using these map display options:
For a comparison of these map display options, see Choose a 2-D Map Display.
Map Axes
Display a basemap image on a map axes using the projected coordinate reference system (CRS) that is stored in the axes. When you display data on map axes using functions such as geoimage and geoplot, you can specify data with coordinates originating in any supported geographic or projected CRS.
Load Data
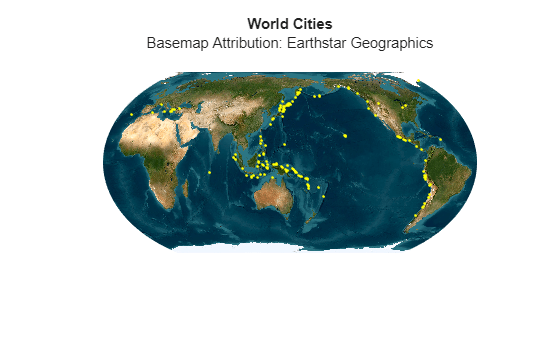
Read a shapefile containing the geographic coordinates of world cities into the workspace as a geospatial table.
cities = readgeotable("worldcities.shp");Specify Projected CRS
Specify the projected CRS you want to use. For this example, create a projcrs object for World Robinson, which has the ESRI authority code 54030.
robinson = projcrs(54030,Authority="ESRI");Read Basemap Image
Specify the latitude and longitude limits for the basemap image.
latlim = [-90 90];
lonlim = [-180 180];
Read an image from the "grayland" basemap as an array and a map cells reference object in Web Mercator coordinates.
[A,RA] = readBasemapImage("grayland",latlim,lonlim);Create Map
Create a map axes object that uses the projected CRS. Then, display the basemap image and the cities. The map axes uses the projected CRS to reproject and display the data.
figure
newmap(robinson)
geoimage(A,RA)
hold on
geoplot(cities)
Add a title and subtitle.
title("World Cities")
subtitle("Basemap Attribution: Made with Natural Earth")

Text in the projected basemap image can appear distorted.
axesm-Based Maps
Display a basemap image on an axesm-based map using the projection method stored in the map. For more information about the projections supported by axesm-based maps, see Summary and Guide to Projections. When you display data on axesm-based maps using functions such as geoshow and plotm, you must specify the data using geographic coordinates.
Load Data
Read the latitude and longitude coordinates of European capitals from a text file.
[lat,lon] = readvars("european_capitals.txt");Read Basemap Image
Specify latitude and longitude limits for the basemap image. Create a quadrangular area of interest (AOI) from the latitude and longitude coordinates. Buffer the AOI by 10 degrees. Then, find the latitude and longitude limits of the buffered AOI.
aoi = aoiquad(lat,lon);
aoi = buffer(aoi,10);
[latlim,lonlim] = bounds(aoi);
Read an image for the region from the "bluegreen" basemap, using a zoom level of 3, as an array and a map cells reference object in Web Mercator coordinates.
[A,RA] = readBasemapImage("bluegreen",latlim,lonlim,3);Unproject Basemap Image
Extract the Web Mercator coordinates of the basemap image from the reference object. Then, unproject the coordinates to geographic coordinates.
[xGrid,yGrid] = worldGrid(RA);
[latGrid,lonGrid] = projinv(RA.ProjectedCRS,xGrid,yGrid);
The coordinates of the European capitals are already in geographic coordinates. If you are adapting this example to your own code and your data is in projected coordinates, you must unproject your data to geographic coordinates.
Create Map
Create an axesm-based map with a projection that is suitable for the region by using the worldmap function. Alternatively, you can create an axesm-based map with a specified projection ID by using the axesm function.
figure
h = worldmap(latlim,lonlim);
View the projection method stored in the map.
getm(h,"mapprojection")ans = 'eqdconic'
The result 'eqdconic' means that the map uses an Equidistant Conic projection.
Display the basemap and the European capitals on the map. The geoshow function projects and displays the latitude-longitude coordinates of the basemap image and capitals using the projection method stored in the map.
geoshow(latGrid,lonGrid,A)
geoshow(lat,lon,DisplayType="point",Marker="pentagram")
Add a title and subtitle.
title("European Capitals")
subtitle("Basemap Attribution: Made with Natural Earth")

Text in the projected basemap image can appear distorted.
Cartesian Axes
Display a basemap image on a Cartesian axes. When you display map data on Cartesian axes, you must specify the data using xy-coordinates. If you display multiple data sets, all the data sets must use the same projected CRS.
Load Data
Read a shapefile containing the coordinates of tsunami events into the workspace as a geospatial table. Extract the latitude and longitude coordinates.
tsunamis = readgeotable("tsunamis.shp",CoordinateSystemType="geographic");
lat = tsunamis.Shape.Latitude;
lon = tsunamis.Shape.Longitude;
Specify Projected CRS and Find Area of Use
Specify the projected CRS you want to use. For this example, create a projcrs object for WGS 84 / Equal Earth Asia-Pacific, which has the EPSG code 8859.
equalEarth = projcrs(8859);
Different projected CRSs are valid for different areas of use. For many projected CRSs, you can find the area of use by displaying the well-known text (WKT) string of the CRS and finding the BBOX attribute. This WKT string specifies BBOX in the second-to-last line.
wktstring(equalEarth,Format="formatted")ans =
"PROJCRS["WGS 84 / Equal Earth Asia-Pacific",
BASEGEOGCRS["WGS 84",
ENSEMBLE["World Geodetic System 1984 ensemble",
MEMBER["World Geodetic System 1984 (Transit)"],
MEMBER["World Geodetic System 1984 (G730)"],
MEMBER["World Geodetic System 1984 (G873)"],
MEMBER["World Geodetic System 1984 (G1150)"],
MEMBER["World Geodetic System 1984 (G1674)"],
MEMBER["World Geodetic System 1984 (G1762)"],
MEMBER["World Geodetic System 1984 (G2139)"],
MEMBER["World Geodetic System 1984 (G2296)"],
ELLIPSOID["WGS 84",6378137,298.257223563,
LENGTHUNIT["metre",1]],
ENSEMBLEACCURACY[2.0]],
PRIMEM["Greenwich",0,
ANGLEUNIT["degree",0.0174532925199433]],
ID["EPSG",4326]],
CONVERSION["Equal Earth Asia-Pacific",
METHOD["Equal Earth",
ID["EPSG",1078]],
PARAMETER["Longitude of natural origin",150,
ANGLEUNIT["degree",0.0174532925199433],
ID["EPSG",8802]],
PARAMETER["False easting",0,
LENGTHUNIT["metre",1],
ID["EPSG",8806]],
PARAMETER["False northing",0,
LENGTHUNIT["metre",1],
ID["EPSG",8807]]],
CS[Cartesian,2],
AXIS["(E)",east,
ORDER[1],
LENGTHUNIT["metre",1]],
AXIS["(N)",north,
ORDER[2],
LENGTHUNIT["metre",1]],
USAGE[
SCOPE["Very small scale equal-area mapping - Asia-Pacific-centred."],
AREA["World centred on Asia-Pacific."],
BBOX[-90,-29.99,90,-30.01]],
ID["EPSG",8859]]"
Specify the latitude and longitude limits for the basemap image by using the information in BBOX. For this projected CRS, unwrap the maximum longitude by adding 360 degrees to the minimum longitude.
latlim = [-90 90];
lonmin = -29.99;
lonlim = [lonmin lonmin+360];
Read Basemap Image
Read an image from the "satellite" basemap as an array, a map cells reference object in Web Mercator coordinates, and an attribution string.
[A,RA,attrib] = readBasemapImage("satellite",latlim,lonlim);Reproject Data and Basemap Image
Reproject the coordinates of the basemap image to Equal Earth coordinates.
Extract the Web Mercator coordinates of the basemap image from the reference object.
Unproject the Web Mercator coordinates to geographic coordinates.
Project the geographic coordinates to Equal Earth coordinates.
[xGrid,yGrid] = worldGrid(RA);
[latGrid,lonGrid] = projinv(RA.ProjectedCRS,xGrid,yGrid);
[xEqualEarth,yEqualEarth] = projfwd(equalEarth,latGrid,lonGrid);
Project the geographic coordinates of the tsunami events to Equal Earth coordinates. If you are adapting this example to your own code and your data is in projected coordinates, you must first unproject your data to geographic coordinates.
[xData,yData] = projfwd(equalEarth,lat,lon);
Create Map
Display the projected basemap image and world cities on a map with no axis labels.
figure
mapshow(xEqualEarth,yEqualEarth,A)
hold on
mapshow(xData,yData,DisplayType="point",Marker=".",Color="y")
axis off
Add a title and subtitle.
title("World Cities")
subtitle("Basemap Attribution: " + attrib)
Text in the projected basemap image can appear distorted.