Main Content

Instrument Explorer

Connect to and communicate with instruments using MATLAB driver

Since R2024a

Description

The Instrument Explorer app provides a user interface to connect and communicate with instruments using a MATLAB® driver. You must have the Instrument Control Toolbox™ Support Package for IVI® and VXIplug&play Drivers. For more information, see Install Instrument Control Toolbox Support Package for IVI and VXIplug&play Drivers.

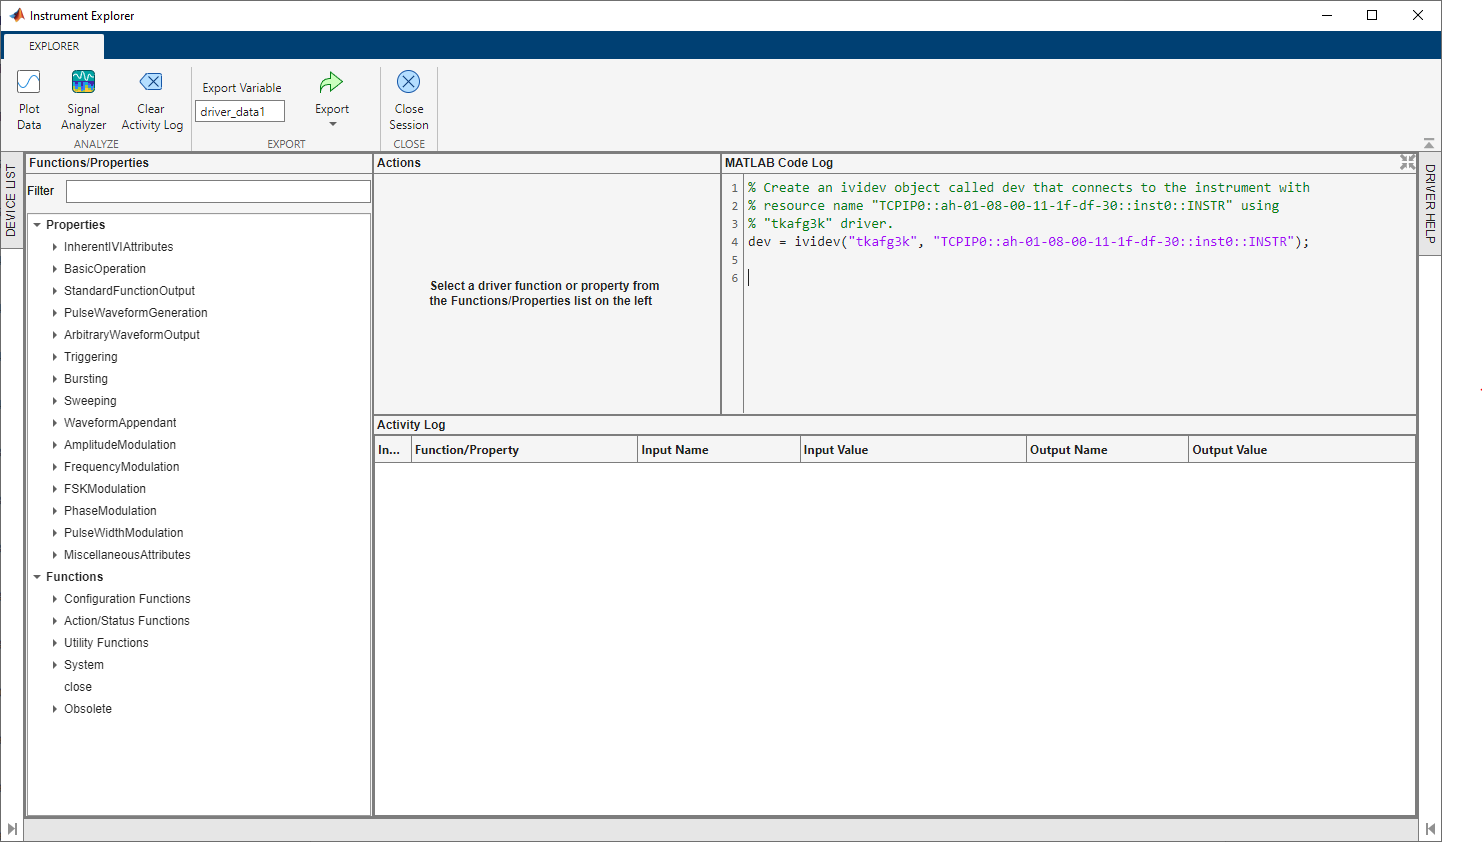
Instrument Explorer app

Open the Instrument Explorer App

  • MATLAB Toolstrip: On the Apps tab, under Test and Measurement, click the app icon.

  • MATLAB command prompt: Enter instrumentExplorer.

Examples

expand all

This example shows how to produce a standard waveform on a Tektronix® AFG3022C function generator.

Step 1: Open, configure, and connect the app.

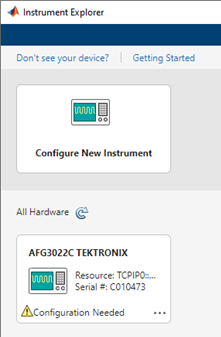
  1. Open the app and see the recognized devices connected to your system. The device card might indicate Configuration Needed.

    Instrument explorer device cards

  2. Click the device card to open the device Configure tab.

    Instrument explorer toolstrip

  3. In the toolstrip, set any configuration parameters necessary for your device and use case. If the configuration parameters are correct, click Confirm Parameters. This validates your settings and connects to the device.

    When connected to your device, the app displays a toolstrip, and panes for Functions/Properties, Actions, MATLAB Code Log, and Activity Log.

Step 2: Communicate with the instrument.

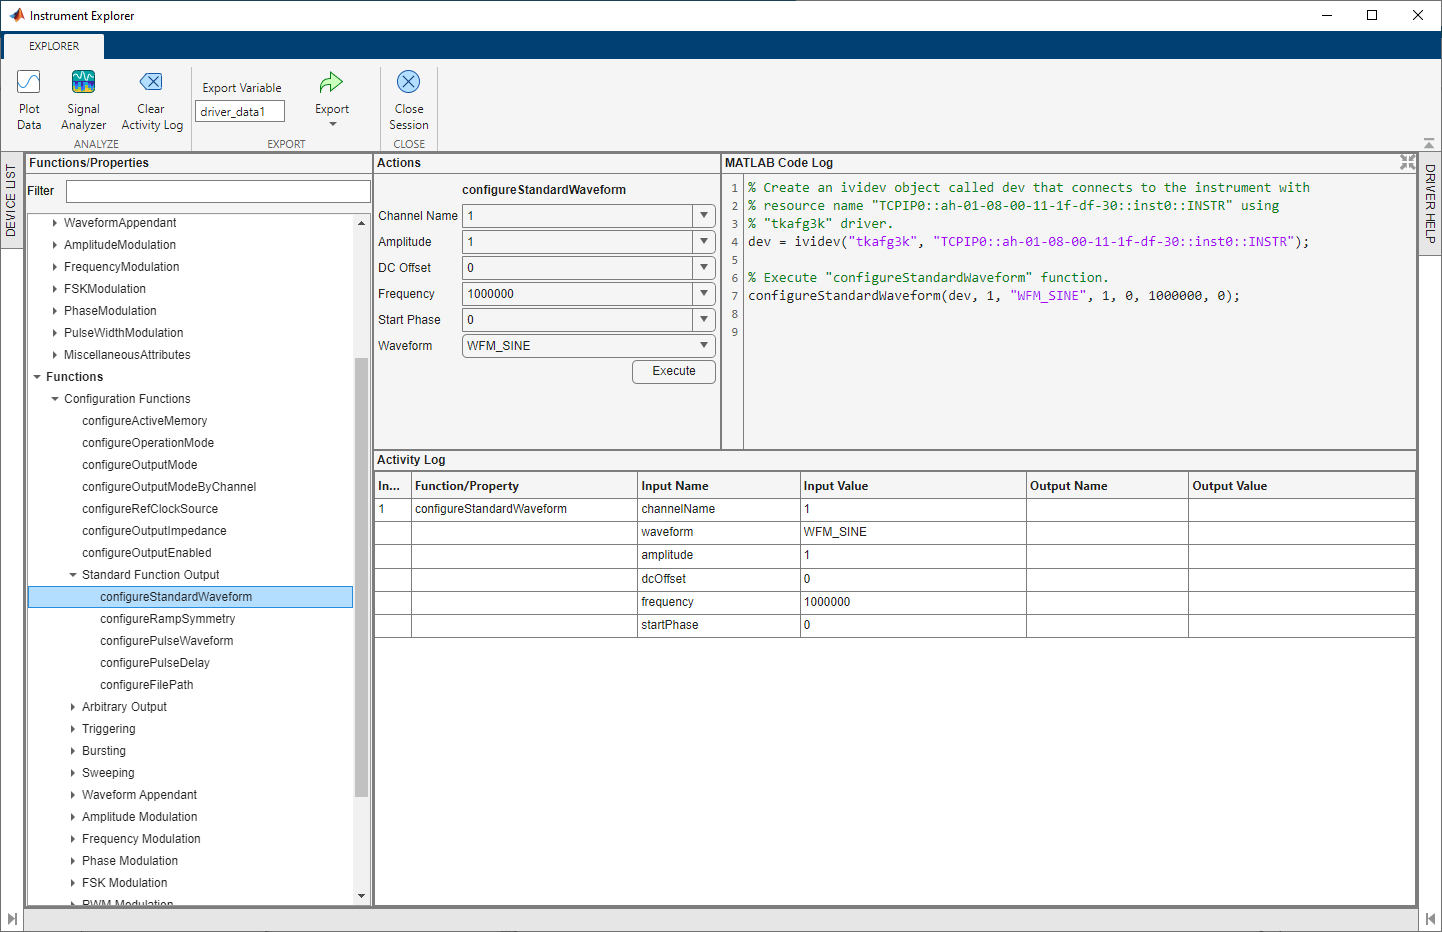
  1. Select configureStandardWaveform in the function list. You can find this by entering the text in the Filter field, or by expanding the tree for Functions > Configuration Functions > Standard Function Output > configureStandardWaveform.

    The Actions pane is filled with the function input fields.

  2. Fill in the values for the function inputs. For detailed information about the function inputs and outputs, click Driver Help.

  3. Click Execute to initiate the operation. The MATLAB Code Log is updated to display the executed code; and the Activity Log is updated to display the operation name, and input and output names and data.

    The display for the waveform generator might look like the following figure.

    Configured device in instrument explorer

To further process the data, you can use the options available in the Analyze and Export sections of the app toolstrip.

Parameters

expand all

Analyze Section

Click Plot Data to open a new figure window that plots the data currently selected in the Activity Log. The selected data must be numeric.

Unlike Write and Read, this operation is not captured in the MATLAB Code Log pane.

Click this button to launch the Signal Analyzer app with the data currently selected in the Activity Log. The selected data must be a numeric vector.

You must have Signal Processing Toolbox™ installed to use the Signal Analyzer app.

Click this button to clear the data in the Activity Log.

Export Section

Edit the name of the workspace variable that you want to export data to. The options in the Export drop-down menu save your data in the workspace as the variable specified in this field.

You must specify a valid MATLAB variable name that does not already exist in the workspace. If you specify an invalid name, it is automatically changed to a valid variable name.

Select one of the following options for exporting log data from this app:

  • Export Selected Cell in Activity Log — Save the data currently selected in the Activity Log to the workspace as the variable specified by Export Variable.

  • Export Activity Log — Save all of the Activity Log data to the workspace as a timetable with the variable name specified by Export Variable.

  • Export MATLAB Code Log — Generate a MATLAB live script populated with the content in the MATLAB Code Log and open it in the Live Editor.

Version History

Introduced in R2024a