Create GPU Kernel Profiles for Generated Code
R2026bThe GPU Performance Analyzer profiles
generated code by measuring the execution time of events such as for-loops
and GPU kernels in the generated code. If a GPU kernel dominates your application run time,
you can generate a kernel profile. The kernel profile includes additional
performance metrics for the GPU kernel, such as:
Achieved occupancy
Compute throughput
GPU memory throughput
Floating-point unit throughput
Use these metrics to understand which GPU resources constrain the kernel execution. For example, if the floating-point unit throughput is high, the floating-point pipeline might limit the kernel performance.
Before generating a kernel profile, enable access to performance counters on your GPU. For more information, see Permission Issue with Performance Counters on the NVIDIA® website.
Enable Kernel Profiling
To generate a kernel profile, you must create a MEX code configuration object and use the object with the GPU Performance Analyzer. You can only generate a kernel profile for MEX functions.
Create a coder.MexCodeConfig object by using the coder.gpuConfig
function.
cfg = coder.gpuConfig("mex");To enable kernel profiling, call the gpuPerformanceAnalyzer
function and set the KernelProfile name-value argument to
true. The GPU Performance
Analyzer generates code for the entry-point function and profiles the application
by running the code twice. Then, the analyzer runs the application again to profile the GPU
kernels.
gpuPerformanceAnalyzer(functionName,inputArgs,Config=cfg,KernelProfile=true);
### Starting GPU code generation
Code generation successful: View report

### GPU code generation finished
### Starting application profiling
### Application profiling finished
### Starting kernel range profiling
### Kernel range profiling finished
### Starting profiling data processing
### Profiling data processing finished
### Showing profiling data
Examine Kernel Profile Metrics
After kernel profiling finishes, the GPU Performance Analyzer opens. To retrieve the kernel profile metrics, in the Profiling Timeline, in the GPU Activities row, select the kernel event. The Event Statistics pane shows a Kernel Profile Metrics section for the kernel.
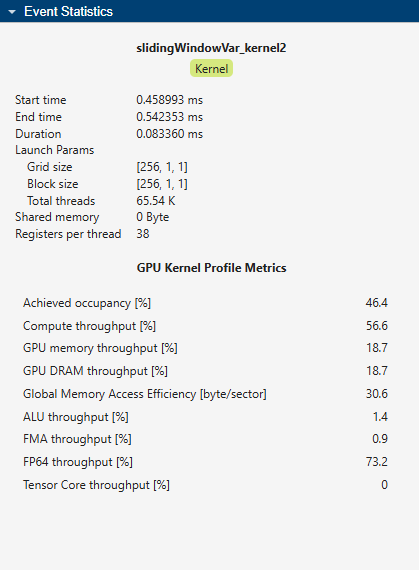
To read the description for a metric, point to the metric name. This table lists the metrics in a kernel profile:
| Metric | Description | How to Use |
|---|---|---|
| Achieved occupancy | Indicates how efficiently the kernel uses the streaming multiprocessors (SMs) on the GPU by measuring the average percentage of active warps relative to the hardware maximum. | Low occupancy indicates the kernel launches with little parallelism or that the computations have high latency. High occupancy indicates that many warps are active, but other factors can limit the kernel performance. |
| Compute throughput | Measures how much of the computational capacity of the GPU that the kernel uses. | High compute throughput indicates that the computational capacity limits the kernel. Low compute throughput suggests a latency or memory bandwidth limitation. |
| GPU memory throughput | Measures memory system utilization, including the L1 cache, L2 cache, and global memory. | Compare the GPU memory throughput with the GPU DRAM throughput. If the GPU memory throughput is significantly greater than the GPU DRAM throughput, the kernel benefits from reusing the cache. If both metrics are high, the kernel moves a substantial amount of data to and from global memory. |
| GPU DRAM throughput | Measures how much of the bandwidth between the L2 cache and global memory (DRAM) that the kernel uses. | High GPU DRAM throughput suggests that global memory bandwidth limits kernel performance. |
| Global Memory Access Efficiency | Reports the average number of bytes the kernel accesses per 32-byte memory sector. This metric represents how efficiently the kernel accesses global memory. | Values approximately equal to 32 indicate that the kernel accesses global memory in a coalesced manner. Low values indicate inefficient global memory access. |
| ALU throughput | Measures the use of the arithmetic logic unit (ALU) pipeline. | High values indicate the kernel performs many integer or logical operations. |
| FP32 throughput | Measures the percentage of single-precision (FP32) floating-point units the kernel uses. | High values indicate the kernel performs many single-precision floating-point computations. |
| FP64 throughput | Measures the percentage of double-precision (FP64) floating-point units the kernel uses. | High values indicate the kernel performs many double-precision floating-point computations. For NVIDIA GPUs, single-precision data types can produce higher throughput and lower memory usage than double-precision data types. |
| Tensor Core throughput | Measures the use of NVIDIA Tensor Cores, which accelerate matrix operations during deep learning workloads. | High values indicate the kernel uses Tensor Cores. If Tensor Core throughput is low, the kernel does not map computations to Tensor Cores. |

