Curved Road
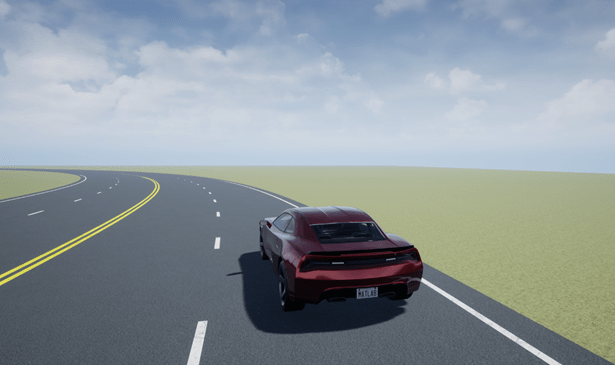
Curved road 3D environment
Description
The Curved Road scene is a 3D environment of a curved highway loop. The scene is created using RoadRunner.
Setup
To simulate a driving algorithm in this scene:
Add a Simulation 3D Scene Configuration block to your Simulink® model.
In this block, set the Scene source parameter to
Default Scenes.Set the enabled Scene name parameter to
Curved road.
Examples
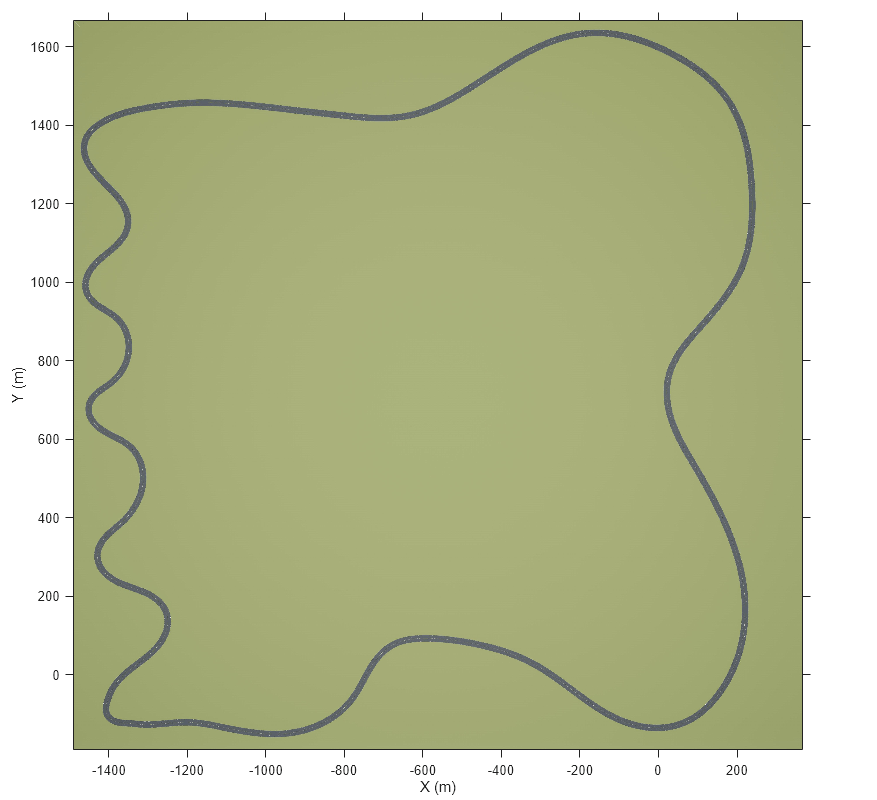
Explore the 3D Curved Road scene and inspect its dimensions by using a corresponding 2D top-view image of the scene.
You can use this image to inspect the scene before simulation and choose starting coordinates for vehicles. For details on using these images to select waypoints for path-following applications, see the Select Waypoints for Unreal Engine Simulation example.
Load the 2D spatial referencing object that corresponds to the scene. This imref2d object describes the relationship between the pixels in the image and the world coordinates of the scene.
data = load('sim3d_SpatialReferences.mat');
spatialRef = data.spatialReference.CurvedRoad
spatialRef =
imref2d with properties:
XWorldLimits: [-1491 368]
YWorldLimits: [-191 1668]
ImageSize: [5020 5020]
PixelExtentInWorldX: 0.3703
PixelExtentInWorldY: 0.3703
ImageExtentInWorldX: 1859
ImageExtentInWorldY: 1859
XIntrinsicLimits: [0.5000 5.0205e+03]
YIntrinsicLimits: [0.5000 5.0205e+03]
Display the image corresponding to the scene. Use the spatial referencing object to display the axes in the world coordinates of the scene. Units are in meters.
By default, the imshow function displays Y-axis values that increase from top to bottom. To align with the Automated Driving Toolbox™ world coordinate system, set the Y-direction to 'normal' so that Y-axis values increase from bottom to top.
figure
fileName = 'sim3d_CurvedRoad.jpg';
I = imshow(fileName,spatialRef);
set(gca,'YDir','normal')
xlabel('X (m)')
ylabel('Y (m)')
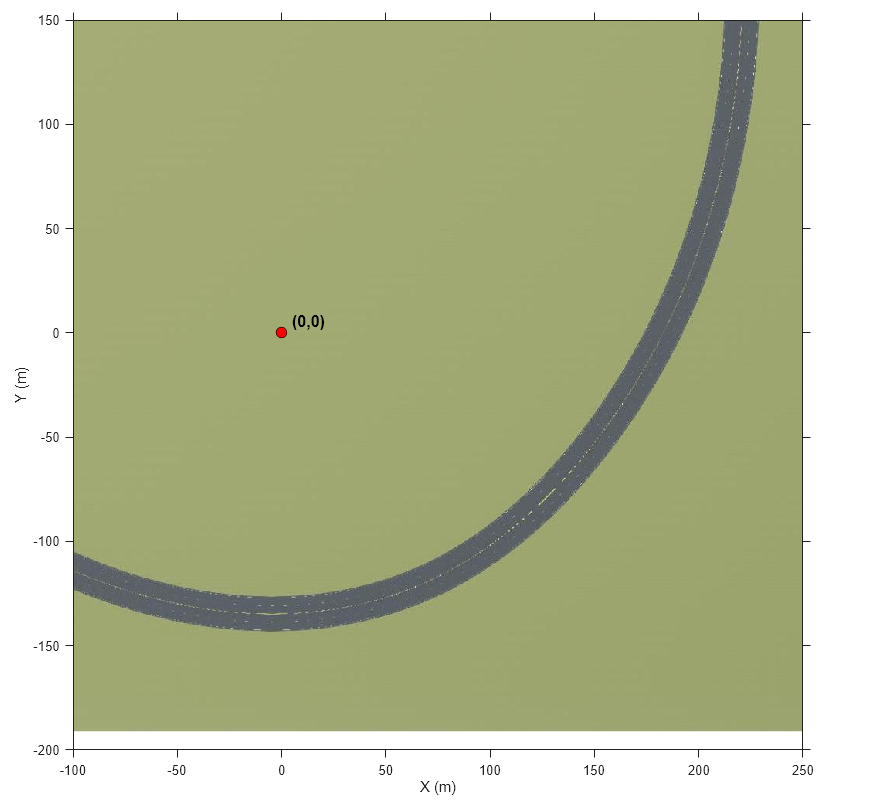
Zoom in on the origin of the scene. Place a marker at the origin.
xlim([-100 250])
ylim([-200 150])

hold on
plot(0,0,'o','MarkerFaceColor','r','MarkerEdgeColor','k','MarkerSize',8)
offset = 5; % px
text(offset,offset,'(0,0)','Color','k','FontWeight','bold','FontSize',12)
hold off
Tips
If you have the Automated Driving Toolbox™ Interface for Unreal Engine® Projects support package, then you can modify this scene. In the Unreal Engine project file that comes with the support package, this scene is named
HwCurve.For more details on customizing scenes, see Customize Unreal Engine Scenes for Automated Driving.
Version History
Introduced in R2019bSee Also
Straight Road | Parking Lot | Large Parking Lot | Open Surface | US City Block | US Highway | Virtual Mcity | Double Lane Change