ezmesh
(Not recommended) 3-D mesh plotter
ezmesh is not recommended. Use fmesh instead.
Description
ezmesh( creates a graph of
f(x,y), where
f)f is a symbolic expression that represents a mathematical function of
two variables, such as x and y.
The function f is plotted over the default domain –2π < x < 2π, –2π < y < 2π. MATLAB® software chooses the computational grid according to the amount of variation that occurs; if the function f is not defined (singular) for points on the grid, then these points are not plotted.
ezmesh(
plots f over the specified f,domain)domain.
domain can be either a 4-by-1 vector [xmin, xmax, ymin,
ymax] or a 2-by-1 vector [min, max] (where,
min < x < max,
min < y < max).
If f is a function of the variables u and
v (rather than x and y), then the
domain endpoints umin, umax, vmin,
and vmax are sorted alphabetically. Thus, ezmesh(u^2 -
v^3,[0,1],[3,6]) plots u2 -
v3 over 0 < u < 1,
3 < v < 6.
ezmesh(___,
plots f over the default domain using an
n)n-by-n grid. The default value for
n is 60.
ezmesh(___,'circ') plots
f over a disk centered on the domain.
Examples
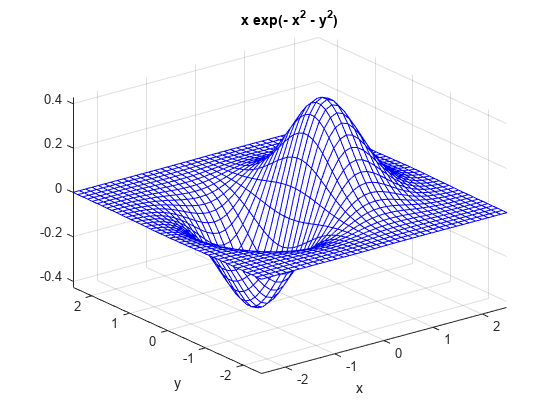
3-D Mesh Plot of Symbolic Expression
This example visualizes the function,
with a mesh plot drawn on a 40-by-40 grid. The mesh lines are set to a uniform blue color by setting the colormap to a single color.
syms x y
ezmesh(x*exp(-x^2-y^2),[-2.5,2.5],40)
colormap([0 0 1])
Input Arguments
Version History
Introduced before R2006a
You can also select a web site from the following list:
Americas
- América Latina (Español)
- Canada (English)
- United States (English)
Europe
- Belgium (English)
- Denmark (English)
- Deutschland (Deutsch)
- España (Español)
- Finland (English)
- France (Français)
- Ireland (English)
- Italia (Italiano)
- Luxembourg (English)
- Netherlands (English)
- Norway (English)
- Österreich (Deutsch)
- Portugal (English)
- Sweden (English)
- Switzerland
- United Kingdom (English)