Oberflächen- und Maschendiagramme
Darstellung von Rasterdaten als Oberflächen- und Maschendiagramme
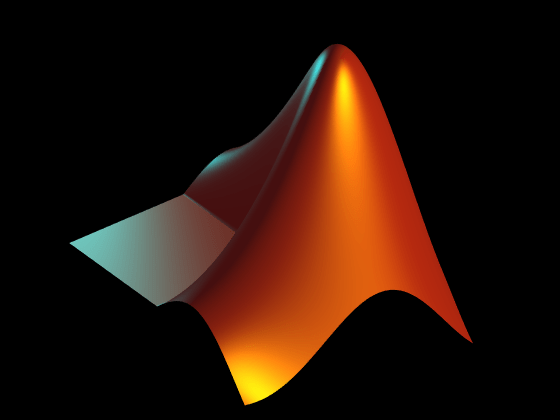
Zeigen Sie 3D-Daten mithilfe von Oberflächen- und Maschendiagrammen an. Erstellen Sie Oberflächen, die aus durchgefärbten oder halbtransparenten Flächen und Flächenkanten bestehen, und erstellen Sie Maschendiagramme, die nur die Flächenkanten zeigen.
Funktionen
Eigenschaften
| Surface Properties | Chart surface appearance and behavior |
| Surface Properties | Primitive surface appearance and behavior |
| FunctionSurface Properties | Surface chart appearance and behavior |
| ImplicitFunctionSurface Properties | Implicit surface chart appearance and behavior |
| ParameterizedFunctionSurface Properties | Parameterized surface chart appearance and behavior |
Themen
- Erstellen von 3D-Diagrammen
Dieses Beispiel veranschaulicht, wie Sie verschiedene 3D-Diagramme in MATLAB® erstellen.
- Changing Surface Properties
This example shows how to get properties of a surface plot in MATLAB® and change the property values to customize your plot.
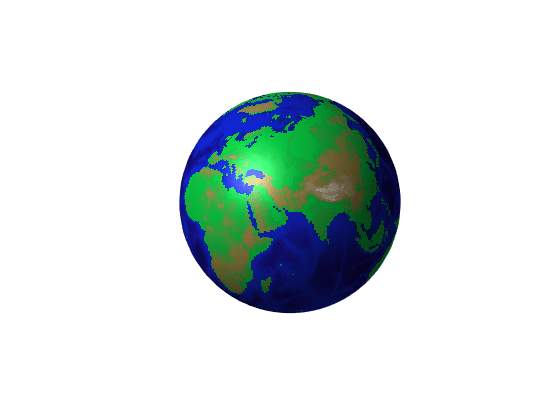
- Representing Data as a Surface
You can visualize matrix data on a rectangular grid using surface plots.
- How Surface Plot Data Relates to a Colormap
Change the relationship between surface plot data and the colormap.
Verwandte Informationen
Enthaltene Beispiele
You can also select a web site from the following list:
Americas
- América Latina (Español)
- Canada (English)
- United States (English)
Europe
- Belgium (English)
- Denmark (English)
- Deutschland (Deutsch)
- España (Español)
- Finland (English)
- France (Français)
- Ireland (English)
- Italia (Italiano)
- Luxembourg (English)
- Netherlands (English)
- Norway (English)
- Österreich (Deutsch)
- Portugal (English)
- Sweden (English)
- Switzerland
- United Kingdom (English)